


In GA4, Reports are one of two distinct ways to analyze data. Reports can contains both predefined and custom reports to give you top-level insights into your data.
Read this blog to dive deeper into GA4 reports and how you can customize reports to fit the unique needs of your business and job role.
A Breakdown of GA4 Reports
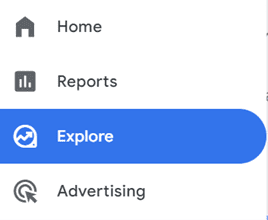
To access GA4 reports, click on “Reports” in the left-hand navigation of your GA4 property:
From here, you have a few options of where to navigate:
- Reports snapshot
- Realtime reports
- Sets of report collections (report group headers) and topics (subsets of reports)
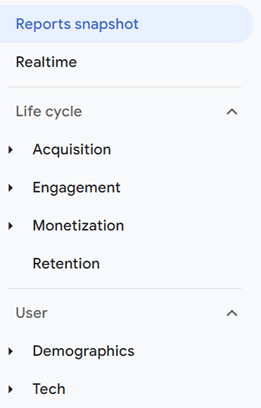
The default report collections are Life cycle and User, and topics are the expandable report groups within these collections, such as Acquisition or Demographics. You might also see tailored report collections automatically generated based on the information you provide at setup, such as the Business objectives collection. All but the real-time reports are fully customizable by account Editors and Administrators.
Reports Snapshot
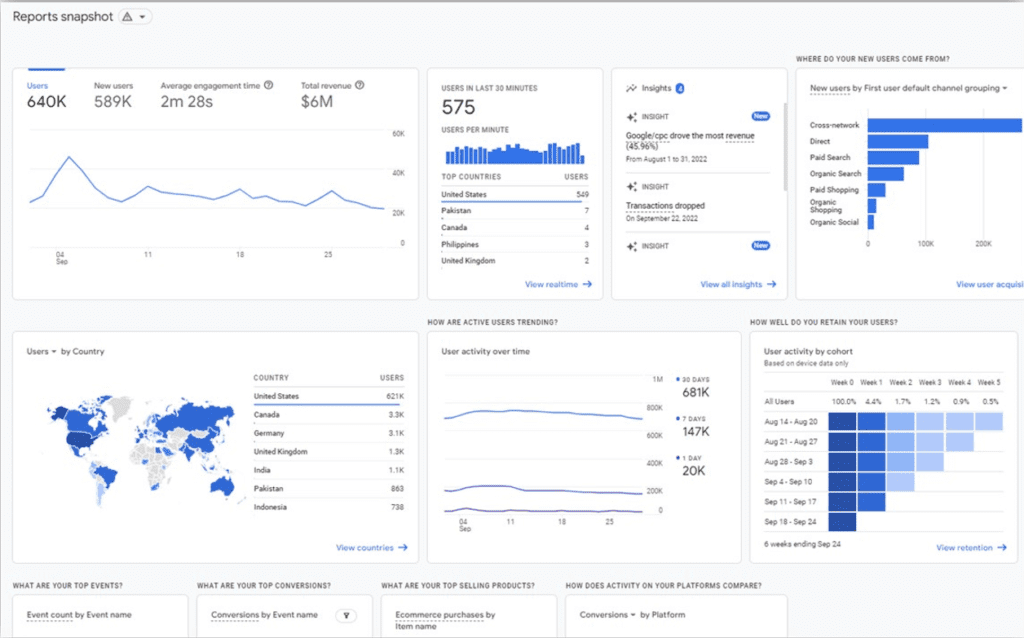
The GA4 Reports snapshot is an overview report that opens by default when you first navigate to Reports. It can contain a collage of any of the summary cards available from any of your Overview reports.
Realtime Reports
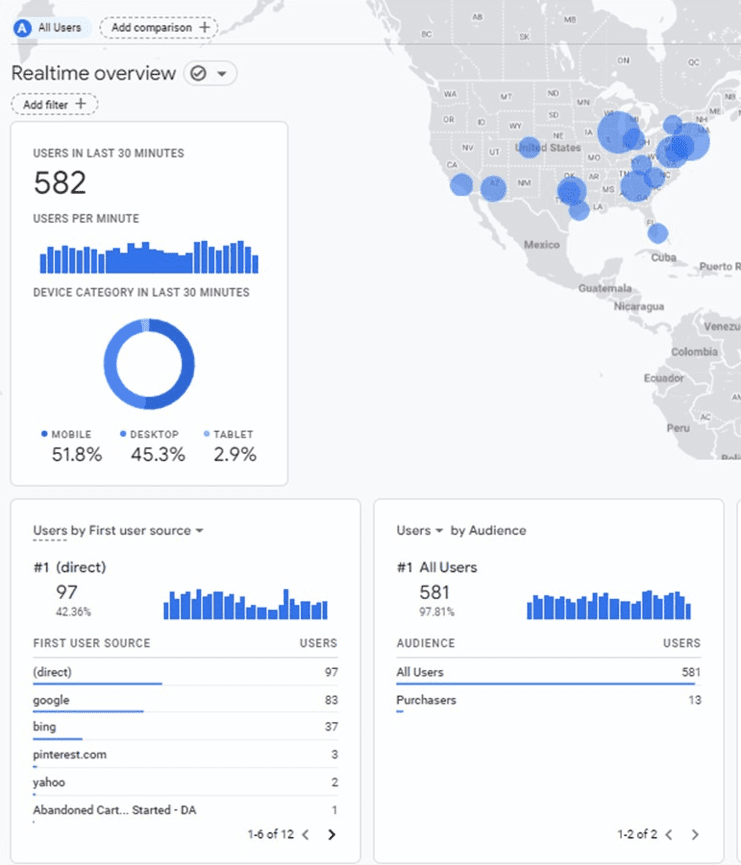
Realtime reports let you monitor current performance by showing information about the users on your website and/or app within the last 30 minutes (i.e. users whose sessions have not yet expired). You can apply comparisons to Realtime reports, but the report cards themselves cannot be edited.
Overview Reports
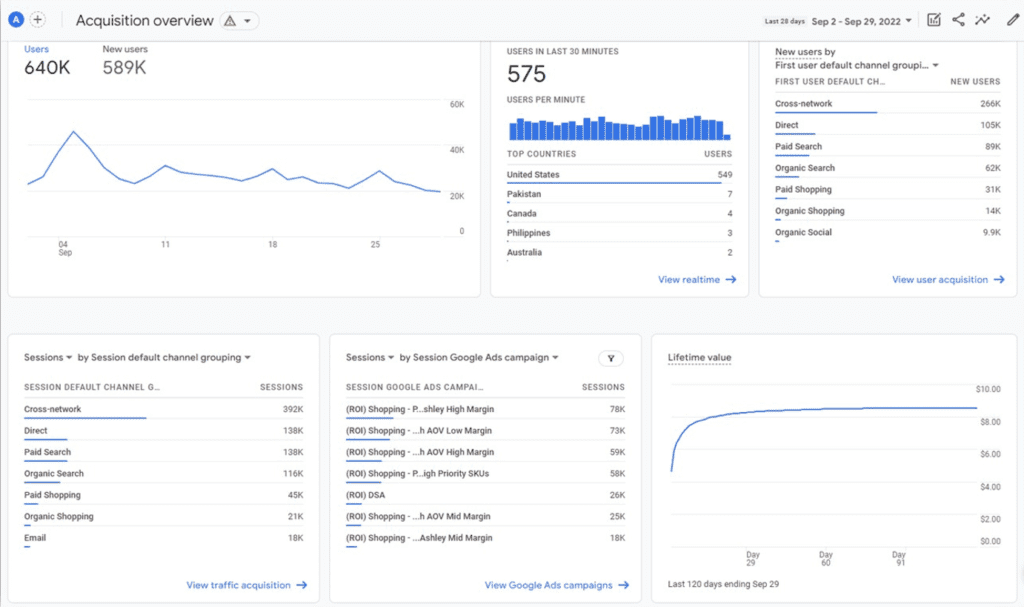
Within Reports, collections contain topics, and each topic typically contains an Overview report. Overview reports are like the Reports snapshot in that they contain summary cards that link to detail reports in the bottom right corner of each card.
Not all linked detail reports are also shown in the left navigation, so going through the Overview report may be the only way to find certain detail reports by default (for example, the Google Ads campaigns report link shown in the following Acquisition overview screenshot).
Detail Reports
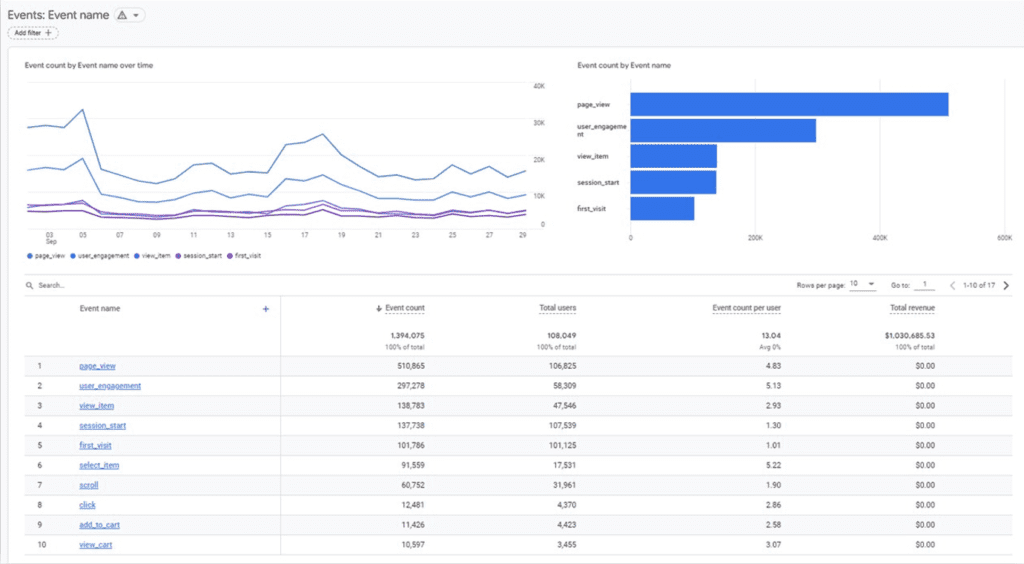
Detail reports are single reports that typically contain a data table, graph, and one additional chart visualization like a bar chart or scatter plot. Data tables in detail reports can show up to 250 rows and can have secondary dimensions and comparisons applied.
Predefined Collections & Topics
GA4 offers predefined reports with a Life cycle collection and a User collection. Both can provide valuable insights into user activity to help you understand the journey your customers take to make a purchase.
The Life Cycle Collection
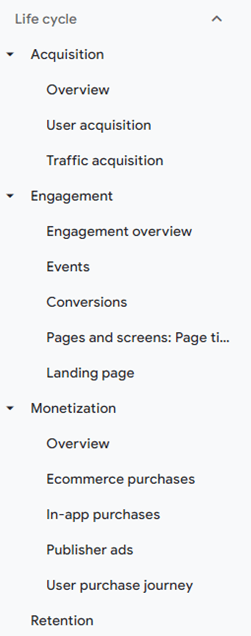
The Life cycle collection of reports is predefined to help you break down user activity at each stage of the customer journey, from acquisition to retention. This collection includes the following topics, each of which houses an Overview report and up to three Detail reports.
Acquisition
Acquisition reports are all about where traffic originated, both from user scope (User acquisition) and session scope (Traffic acquisition).
These two detail reports are structured the same way, but with different approaches to attribution. You can think of User acquisition as a first-touch model, whereas Traffic acquisition is a last-touch model.
Attribution models chosen at the property level are not applied to acquisition reports. They’re tied specifically to Conversion reporting.
Engagement
Engagement reports highlight the engagement users have with your website or app after they arrive. This collection houses reports on events, conversions, and pages, with metrics like engagement rate and user stickiness.
Monetization
This topic contains ecommerce reporting as well as additional reports that may or may not be applicable to your business, such as in-app purchases from mobile apps and ad revenue from publisher platforms like AdMob.
Retention
Retention is currently a standalone oOverview report of sparklines to show how frequently and how long users engage with your website, with users grouped into cohorts.
The User Collection
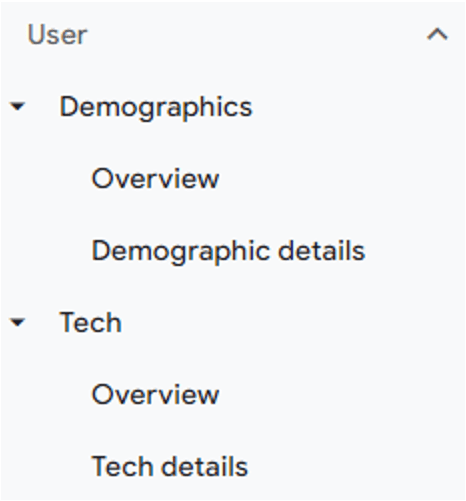
The User collection is designed to tell you more about the users engaging with your website or app, such as their ages, interests, and devices.
Demographics
Demographics reports classify users by age, location, language, and gender, along with interests they express through their online browsing and purchase activities.
Tech
Tech reports provide details on user platforms, devices, operating systems, and browsers.
Customizing Your Reports in the Library
With Administrator or Editor access, you can create new collections, topics, and reports. You can also edit any of the existing collections, topics, or reports to fit the specific needs of your business. For example, if you have a lead gen site that doesn’t track any revenue-generating metrics, it might be smart to delete the monetization reports.
ROI Tip: The changes you make to Reports are applied to everyone with access, and it’s not possible at this time to have a private report collection. Be sure to collaborate with your team and relevant stakeholders to ensure everyone agrees with changes made to pre-existing reports – or, simply start fresh with your own report collection.
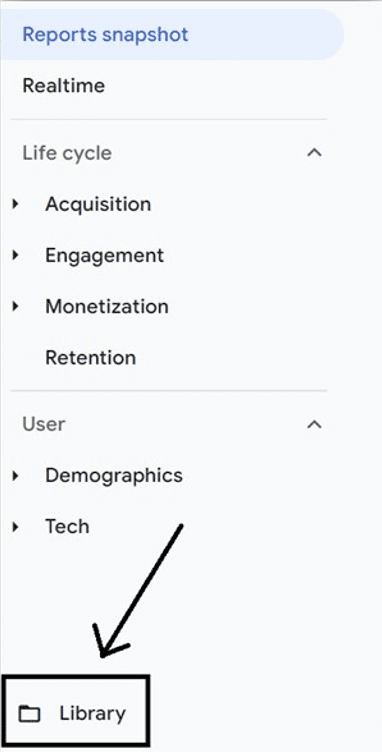
To customize reports, navigate to the Library feature at the bottom of the Reports section. As mentioned above, editing and creating reports requires Administrator or Editor access, so if you don’t see this option, you need a higher level of access:
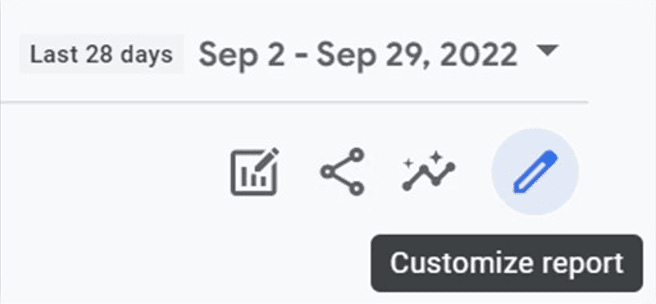
You’ll find all the prebuilt reports mentioned above within the Library. You can click to edit them from there. You can also edit existing reports by clicking the pencil icon in the top right corner of any report:
Creating Detail Reports
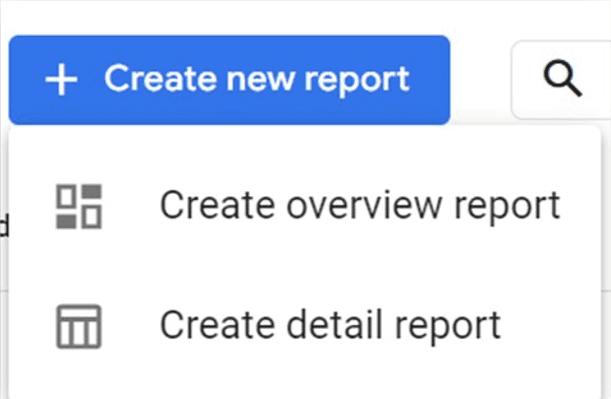
From the Library, click “Create new report” and choose if you want to build an overview report or a detail report:
Start with a detail report first, since overview reports are built of summary cards from detail reports. You’ll be able to choose a starting template or start a blank report from scratch.
Building a report is a lot like building a custom report in Universal Analytics, but even more simplified! You can select as many dimensions as you need and up to 12 metrics. In your report, your selected dimensions will be provided as dropdown primary dimension options. Secondary dimensions can only be applied outside of the initial report configuration.
Finish out your report by adding dimension-based filters, selecting chart types, and building the summary cards you’ll want to have in your Overview reports. When you finish designing your report, save it and give it a name and description.
Creating Overview Reports
The summary cards you’ll add to your overview reports are created within your detail reports, so make sure not to skip this step when building a detail report.
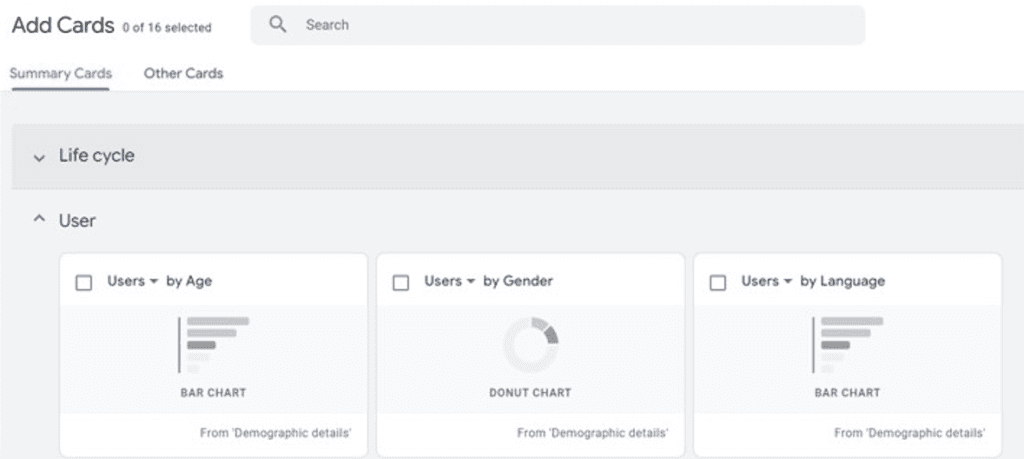
After your topic’s detail reports are complete, you’ll want to create an overview report and select the summary cards you’d like to display in your overview. Within the report configuration, you’ll be able to expand or collapse collection headers to find the summary cards from your specific collection. You may also find useful cards in the “Other Cards” tab.
Designing Collections & Topics
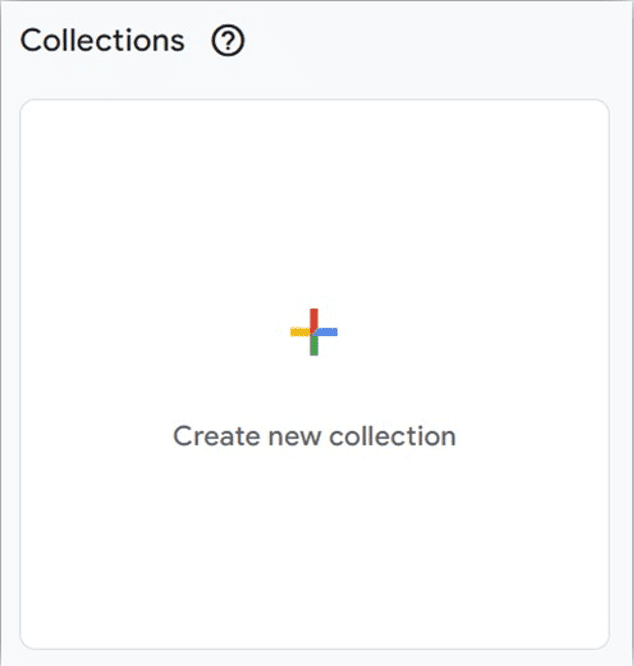
After you’ve finished building all the detail and overview reports for your collection, click “Create new collection.” Once again, you can start from a template or build a blank collection from scratch:
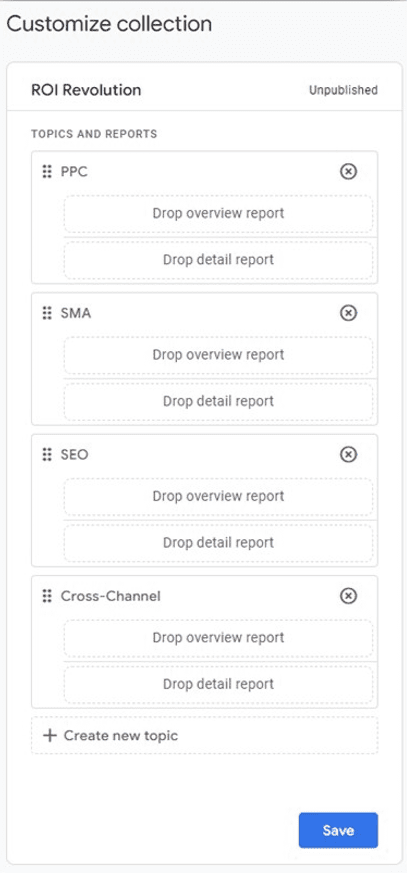
For example, you might want to call your report “(Your Name)’s Favorites” to show other users that your report collection was designed for your unique needs. Similarly, other teams at your business might build their own collections with topics that represent the different marketing channels they manage.
Be sure to think about the data that is most important to you and go from there to design your ideal report structure. From here, you can drag and drop your reports (see screenshot below) into your collection design. When you’re done, click Save and return back to the main Library screen:
Publishing a Collection
After you’ve finished designing your reports, topics, and collection, you’ll need to publish the collection before it begins showing up in your Reports navigation.
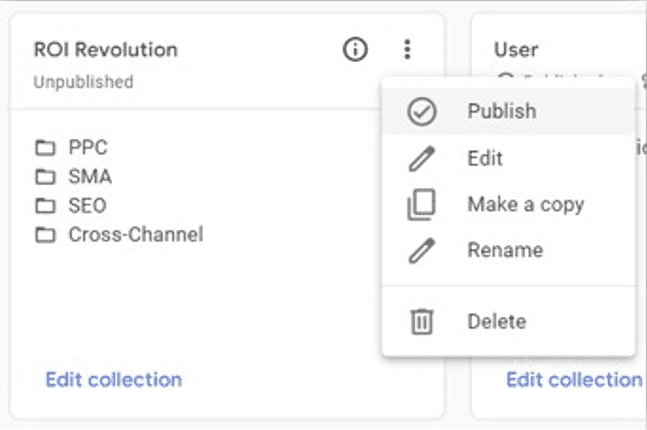
To do this, go to the main Library page, find your collection across the top, click the three dots, and select “Publish:”
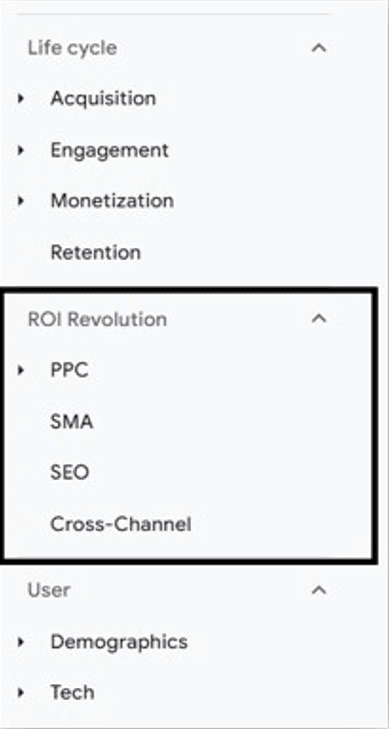
You will now see the reports in your main Reports lineup (and so will everyone else!). Collections are listed in alphabetical order, but you can force an order by adding numbers to the starts of each collection name.
It’s also worth noting that publishing collections and organizing reports into collections and topics is not required. If you save a report without adding it to a collection or publishing that collection, you can still access the report at any time by navigating to the Library screen.
Keep in mind that Reports are very limited, so you should design these to be as top-level as possible. Not all dimensions and metrics are available. If you run into roadblocks, your report design may be better for Explore or Looker Studio.

Tying It All Together: Customizing the GA4 Report Library
If you feel overwhelmed by the transition to GA4, you’re not alone. It’s an entirely new way to track and analyze your most important data, and being able to leverage it to meet your goals is crucial. If you think your business could benefit from having a team of GA4-certified experts by your side for this new journey, send a message to our team today.
Sources
- Google Analytics Help, Customize reports.
- Google Analytics Help, [GA4] Understanding Google Analytics Reports.
- Google Analytics Help, [GA4] Reports snapshot.
- Google Analytics Help, [GA4] Realtime report.
- Google Analytics Help, [GA4] Collection.
- Google Analytics Help, [GA4] Topic.
- Google Analytics Help, [GA4] Apply comparisons to reports.
- Google Analytics Help, [GA4] Customize report navigation.