


Google Analytics (GA4) is the newest version of Google Analytics and replaced Universal Analytics on July 1, 2023. At that time, UA stopped collecting new data, and GA4 became required for all Google Analytics tracking purposes moving forward. In this blog, we’ll reveal all the latest news you need to know about the transition to GA4 and how your brand can stay ahead of the curve. Bookmark this article so that you can stay up-to-date with the most current information on Google Analytics 4 (GA4)!
Are you on the path to achieving your brand’s potential with GA4? Take your brand where it’s meant to go. To explore the heights you could reach with a guide to show you the way, book a meeting with our team today.
Quickly jump to each update on Google Analytics 4 using the links below:
GA4 reports
- Webinar replay: Building Impactful Custom Reports in GA4 (How-To & Live Q&A) (August 10, 2023)
- Upcoming webinar: Building Impactful Custom Reports in GA4 (How-To & Live Q&A) (July 10, 2023)
- Webinar replay: Navigating GA4 Reports & Explorations (June 30, 2023)
- New resource: Customizing the GA4 report library (June 8, 2023)
- Deciding where to start with GA4 reports (January 26, 2023)
- Customizing your reports in library (January 12, 2023)
- Reports, explorations, & spreadsheets to understand your GA4 attribution data (April 13, 2023)
- Questions to ask yourself before getting started with GA4 attribution reports (March 23, 2023)
- Exploring predefined report collections & topics in GA4 (January 4, 2023)
- A breakdown of reports in GA4 (December 16, 2022)
GA4 tools
- New resource: Choosing which tool to use in GA4 (June 15, 2023)
- Figuring out where to start with GA4 tools (March 9, 2023)
- How to choose the right tool to navigate your GA4 data (February 9, 2023)
GA4 basics
- Your GA4 resource repository (September 14, 2023)
- How to set up your GA4 integration with BigQuery (August 29, 2023)
- A quick GA4 Q&A (November 10, 2022)
- Getting More Out of GA4: Webinar Replay (October 27, 2022)
- 4 keys to setting up GA4 for success (October 13, 2022)
- Updates on Google Analytics 4 data retention (October 10, 2022)
- Scope & lookback windows in GA4 (September 9, 2022)
More GA4 updates and news
- Google Updates Attribution Models in GA4 (June 20, 2024)
- Using GA4 to optimize your holiday strategy (November 9, 2023)
- GA4 strategies for Cyber 5 (October 12, 2023)
- How to identify GA4 tracking issues (July 13, 2023)
- Upcoming webinar: Navigating GA4 Reports & Explorations (June 22, 2023)
- New resource: Understanding scope in GA4 (May 26, 2023)
- Google announces that Optimize won’t be offered in GA4 (February 23, 2023)
- ROI Revolution becomes GA4-certified! (October 5, 2022)
- What you need to know about GA4 attribution models (August 30, 2022)
Google Updates Attribution Models in GA4
June 20, 2024
Google shared last week that they will be rolling out changes to their attribution models in GA4 over the next couple of weeks. A definitive date for these changes to be completed has not yet been shared. But we do know that these changes will greatly affect PPC marketers, especially those working with single-page application sites.
Google stated that their goal is to improve conversion tracking from paid search campaigns. It appears that several of the conversions that are currently being attributed to organic traffic may actually be coming in from paid search efforts.
What is Google changing in GA4 attribution?
The error they are hoping to remedy has most commonly been occurring in single-page applications when the ‘gclid” parameter falls off after multiple page views. This results in conversions being attributed to organic search that should be attributed to paid search. Google has made an update that will capture campaign information on the first event on each webpage to ensure that issue does not continue to happen.
What do these changes to attribution in GA4 mean for my brand?
PPC teams should be warned that this could have strategic implications over the next few weeks as accuracy of attribution increases, and more conversions are attributed to paid advertising efforts.
The update could present a major opportunity to capitalize on campaigns that are far more efficient than once thought based on the old data. Marketers are encouraged to take a close look at their budget capped campaigns ahead of this transition to better position their brand to optimize around the new data.
Closely monitoring spend across all ad campaigns during the transition will be crucial for brands that don’t want to miss a beat and want to make the most out of this update.
Stay tuned for more updates on Google Analytics 4 here. If you could use help with GA4, reach out to our team today. We have a team of analytics experts waiting to help your brand reach data science nirvana!
Using GA4 to Optimize Your Holiday Strategy
November 9, 2023
The Q4 shopping season has officially arrived! With GA4 in full force, 2023 is bringing change to how businesses understand their campaign performance.
One of the biggest changes is latency. With GA4, conversions can take up to 72 hours to be reported. This isn’t ideal during critical periods like Black Friday, when marketers are typically refreshing their computers and watching the latest numbers come in to make in-the-moment changes.
But there is a way to get around this. With BigQuery, you can query data within the last hour (or even minute), giving you the ability to make optimizations and get the most you can out of Cyber Week.
Want to learn more? Watch our video on Using GA4 to Optimize Your Holiday Strategy.
GA4 strategies for Cyber 5
October 12, 2023
This is the first year that brands are having to use GA4 during the critical Cyber 5 period. Are you ready to achieve your highest potential using the new platform? Keep reading to learn about useful GA4 reports for Cyber 5 and what you need to know about latency during Q4 seasonality.
Useful GA4 Reports for Cyber 5
When it comes to Cyber 5, knowing the right reports to look at in GA4 will be key to understanding your campaign performance and making sure you’re putting your marketing dollars in the best places. Here are some of the reports you’ll want to pull.
All Channels Performance: Use to compare how each Analytics version attributes revenue/conversions across the entire marketing mix
- How to access in GA4: Advertising > Performance > All Channels
- Previously accessible in Universal Analytics (UA) at: Acquisition > All traffic > Performance
Model Comparison Reports: Use to get a quick, direct comparison of how multi-touch (DDA) attribution compares to previous single touch attribution models of UA.
- How to access in GA4: Advertising > Attribution > Model Comparison
Custom Explore Reports: Use to create path exploration or funnel exploration reports and easily visualize how events or conversions spurred by specific channels push users through the purchase journey.
- How to access in GA4: Explore > New exploration
Data Freshness in GA4
You’ll also want to understand how fresh your data is in GA4. According to Google:
“Data freshness is how long it takes Google Analytics to collect and process an event from your property. If that process takes 20 minutes, then data freshness is 20 minutes.”
Couple data freshness with multi-touch attribution, and reports for any given day may continue to change for up to 72 hours.
To determine what your latency is:
- Select a few recent date ranges (i.e. today, yesterday, last 3 days).
- Download performance data.
- Repeat in ~12-hour increments for the exact same range for the next 72 hours.
Keep in mind that the key performance metrics impacted by latency include conversion rate, ROAS, and cost per acquisition.
If you’re like most brands, Q4 is a critical time for achieving your yearly revenue goals. Are you on the path to achieving your highest potential? The GA4-certified experts at ROI Revolution help brands navigate the path to where they want to go. To explore what it means to have a guide you can trust, book a meeting with our team today.
Explore more holiday ecommerce strategies on our blog.

Your GA4 Resource Repository
September 14
For many marketers, the transition to GA4 has been overwhelming. Getting the resources you need to succeed on the new platform doesn’t have to be. Browse the resources below for the latest updates from our GA4-certified experts.
How to Set Up Your GA4 Integration With BigQuery
BigQuery provides a new world of possibilities with GA4 data. The insights you can gain go beyond what’s possible to achieve in the GA4 UI alone. The first step is to know how to set up your GA4 integration with BigQuery. Read more.
GA4 FAQ
We’ve collected some of the most commonly asked questions about GA4 and answered them in this blog. Learn about getting started with GA4, making sense of new features, and more. Read more.
How to Choose the Right GA4 Tool to Navigate Your Data
GA4 provides many techniques to analyze and report on data. Gain an understanding of each tool’s value and where to begin when trying to navigate your data. Read more.
Customizing the GA4 Report Library
Your business has unique use cases for GA4. Predefined and custom reports can help you gain the top-level insights you need. Read more.
Building Impactful Custom Reports in GA4
GA4 differs vastly from Universal Analytics. In this webinar replay, our experts reveal the top reports to build for a seamless transition. Watch the video.
Navigating GA4 Reports & Explorations
Do you know how to navigate GA4 so that you can easily surface critical insights? In this webinar replay, discover the keys to unlock profitable brand growth with GA4. Watch the video.
Understanding Scope in GA4
Understanding scopes in GA4 is fundamental to building, interacting with, and interpreting reports. Learn about the three types of scope: user, session, and event. Read more.
How to Spot Tracking Issues in Google Analytics 4
GA4 can provide powerful insights into user behavior on your website. But that hinges on your data being accurate. Discover best practices to identify and address tracking issues. Read more.
Infographic: The 411 on GA4
What should you do to ensure you’re set up for success with GA4? How long are the lookback windows? How does GA4 compare to UA? Get the answers to these questions and more. Read more.
How to Set Up Your GA4 Property for Success
Event tracking, custom dimensions, and property settings, oh my! Migrating to GA4 requires lots of significant considerations. Here are some key points to consider. Read more.
Getting More Out of GA4: Attribution Key Concepts
What is scope in GA4? What are the different attribution models? How long is data retained in the new platform? Get a high-level overview of the most important things you need to know about GA4. Read more.
GA4: Understanding the New Generation of Attribution
Dive into the next generation of Google Analytics in this webinar replay that includes a walk-through of a GA4 account. You’ll learn about attribution modeling, lookback windows, data retention, and more. Watch the video.
ROI Revolution Is Now a GA4-Certified Agency!
ROI Revolution was once of the first agencies to become GA4-certified. What does this mean for brands that are looking to use GA4 to make impactful business decisions? Read more.
When you have a trusted guide by your side, your business can thrive beyond what you thought was possible. To discover the untapped opportunities that our GA4-certified experts can help you discover, send a message to our team today.

How to Set Up Your GA4 Integration With BigQuery
August 29
If you’ve worked in Google Analytics 4 (GA4) at all, you’ve probably felt limited by the UI in the platform. BigQuery can introduce a new world of insights to gain from your data. This powerful and scalable platform can help you make data-driven decisions to drive your business forward.
In this blog, you’ll learn how to set up your GA4 exports to BigQuery by following these steps:
- Creating a GCP account
- Setting up billing
- Connecting GA4 to your BigQuery project
Don’t let your brand’s success hinge on not being able to discover actionable insights. Read the blog to learn how to set up your GA4 integration with BigQuery.

Webinar replay: Building Impactful Custom Reports in GA4
August 10
Do you feel ready to drive your brand’s growth forward with Google Analytics 4 (GA4)? Our GA4-certified experts can help you get there.
In this webinar replay, you’ll learn how to build the most impactful custom reports in GA4, including:
- Landing page reports
- Regional comparison reports
- New vs. established users reports
- Product performance reports
- And more!
This is your chance to learn the ropes of GA4 reporting from a group of certified experts. Watch the replay now.

How to identify GA4 tracking issues
July 13, 2023
Tracking and analyzing website data is an essential part of any business strategy. When using GA4, it’s crucial to identify and address legitimate tracking issues in order to:
- Ensure your data’s accuracy, reliability, and integrity
- Gain valuable insights about user behavior, conversion rates, and revenue sources
- Make informed decisions based on reliable information
To ensure data accuracy in GA4, it’s essential to compare key metrics such as users, sessions, and total revenue between GA4 and Universal Analytics (UA). Read this comprehensive blog to walk through how you can easily uncover and resolve GA4 tracking issues.

Upcoming webinar: Building Impactful Custom Reports in GA4 (How-To & Live Q&A)
July 10, 2023
By now, you should know how to navigate the GA4 interface – but you might be wondering where to start when it comes to building reports that are relevant and impactful to your business. GA4 is inarguably different than Universal Analytics, and it can be overwhelming to get started.
In this webinar on August 8th at 2 pm EST, you’ll discover the top custom reports you should set up in your GA4 property for a seamless transition. You’ll learn:
- How to find some of the same data you used to look at in Universal Analytics
- What new, unique reports you can build directly in the GA4 interface
- Why Looker Studio is a powerful resource for reporting and when you should use it
- How to harness the data you need despite scope and compatibility limitations within GA4
- Why you should link your GA4 account to BigQuery
By using GA4 data to its full potential, you can uncover the insights you need to drive your business forward. Register now to attend this exciting live webinar!

Webinar replay: Navigating GA4 Reports & Explorations
June 30, 2023 update
Are you prepared to navigate the Google Analytics 4 (GA4) platform? Do you know how to build and customize it to meet your business needs?
In our webinar on Navigating GA4 Reports & Explorations, the GA4-certified experts at ROI Revolution shared their favorite GA4 reports and how to build them. Watch the webinar replay to discover how to:
- Customize reports to fit your unique needs using the GA4 Library feature
- Leverage Funnel, Path, and Cohort Analyses to drive deeper insights
- Understand the structure of the GA4 Home page, Custom Insights, and Reports
Marketers are now expected to know how to be able to use GA4. Don’t fall behind. Watch the webinar replay to learn how to leverage GA4 to its full potential so you can make data-driven decisions.

Upcoming webinar: Navigating GA4 Reports & Explorations
June 22, 2023 update
The clock is ticking to feel confident about the transition to GA4. While GA4 offers many exciting new customizations, learning how to navigate a new platform easily becomes overwhelming – especially when the insights from the data are crucial to your organization.
In the Navigating GA4 Reports & Explorations webinar on June 27th at 2 pm EST, you’ll be guided through how to navigate and customize the new interface to easily surface the most important insights for your business. You’ll leave knowing how to:
- Edit existing report structures to fit your unique needs
- Build new custom reports & dashboards to support different roles within your organization
- Analyze data in detail with Explorations
When you leverage GA4 to its full potential, you can drive your business forward with data-informed decisions. Register for the webinar now so that you feel ready for the July 1st transition.

New resource: Choosing which tool to use in GA4
June 15, 2023 update
GA4 offers multiple different ways to analyze and report on data, both within the UI itself and in external tools. These tools include:
- Reports
- Explorations
- Spreadsheets
- Looker Studio
- BigQuery
This new eight-page guide will help you understand how each tool works, plus questions you should ask yourself to figure out where to start when choosing a tool. Download the resource to grow your understanding of GA4.

New resource: Customizing the GA4 report library
June 8, 2023 update
The Google Analytics 4 (GA4) user interface includes four distinct areas to analyze data:
- Home: Shows you relevant information based on your previous behavior in GA4.
- Reports: Contains predefined and custom reports to give you top-level insights into your data.
- Explore: Allows you to uncover deeper insights than what’s possible in Reports with a collection of advanced data analysis techniques.
- Advertising: Provides various tools for analyzing multi-channel attribution modeling and conversion paths
Download this eight-page resource to dive deeper into the types of Reports available in GA4, predefined collections and topics in GA4, and how to customize Reports to fit your unique needs.

New resource: Understanding scope in GA4
May 26, 2023 update
Scope is a characteristic that describes the extent to which a GA4 metric or dimension can be applied. With scope, Google can apply attribution credit at different levels of granularity.
It starts with the smallest scope of the conversion event itself. Then, it looks at the session that led to a user’s conversion. Lastly, it zooms out to look at the user’s whole journey and how they originally reached your website.
There are three main types of scope: user scope, session scope, and event scope. Under event scope, there are three types of attribution models: cross-channel data-driven, cross-channel last-click, and ads-preferred last-click.
For a more detailed overview of scope, read our blog on understanding scope in GA4 or view the PDF. You’ll learn more about the types of scope, including more in-depth definitions, as well as the traffic source dimensions and available metrics for each type of scope.
On Tuesday, June 27th at 2 pm EST, you’ll have the chance to dive even deeper into the new platform with our webinar on Navigating Reports & Explorations in GA4. Our GA4-certified experts will walk you through customizing GA4 so that you can easily surface the most important insights for your business. Register for the webinar now so that you feel ready for the July 1st transition.

Reports, explorations, & spreadsheets to understand your GA4 data
April 13, 2023 update
In our February 9th update, we shared some insights on using Reports, Explorations, spreadsheets, Looker Studio, and BigQuery to understand your GA4 data. In today’s update, we’re expanding on that with some additional information. Keep reading to keep learning the ropes!
Reports
Reports provide snapshots and simple tables for a high-level understanding of your data. You can customize these aggregated tables, overview cards, and detail reports to look at your most important data – which was never possible with Universal Analytics.
However, unlike in UA, GA4 Reports aren’t designed to be heavily sliced and diced for deep analysis. Filtering, segmenting, and drilldown capabilities are limited.
Don’t forget to check the Analytics Home page for automated and custom insights via Analytics Intelligence! This feature uses machine learning and custom configurations to help you easily understand and act on your brand’s data.
Explorations
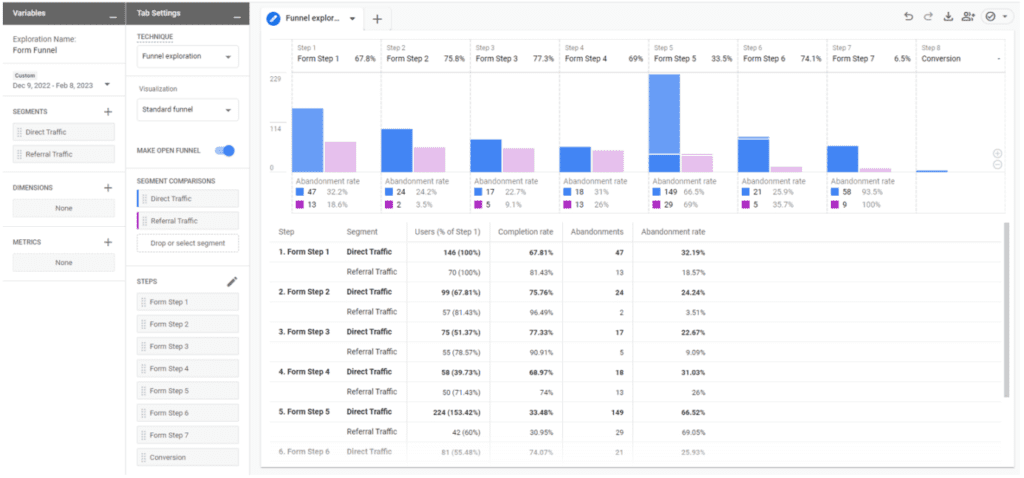
Explorations provide a deeper dive into your data with more actionable insights than Reports, with the ability to perform advanced data analysis, quickly execute ad-hoc queries, sort and drill down sort data, add filters and segments, and export results to other products.
Explorations offer more data analysis capabilities than just free-form tables, including with capabilities like:
- Funnel and Path explorations
- Segment overlaps
- Cohorts
- User Lifetime reports
A few important notes on the Explore feature:
- Explorations you create are unable to be collaborated on by other users
- Data is subject to sampling
- Date ranges are restricted to either two monhttps://www.roirevolution.com/events/navigating-GA4-reports-and-explorations/ths or 14 months of data
Spreadsheets
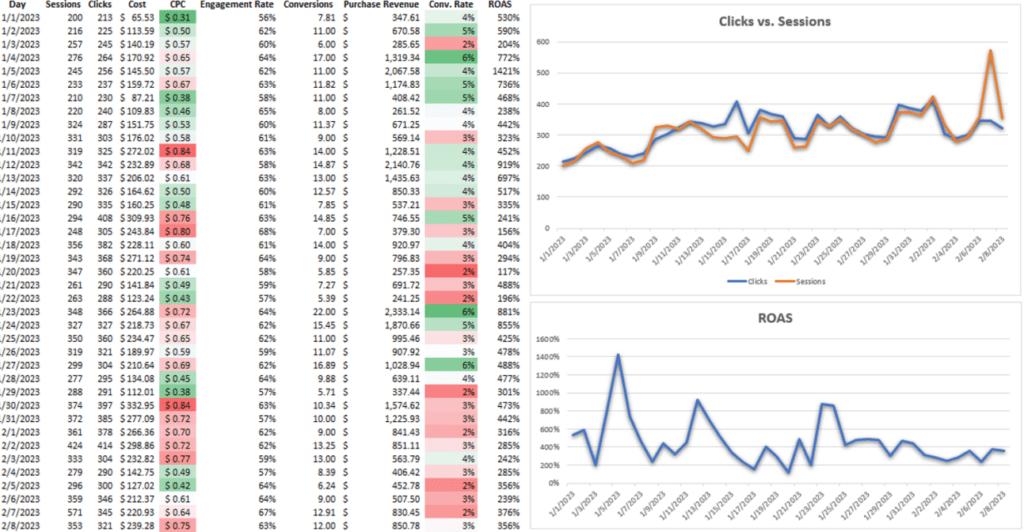
You can take your analysis a step further than Explore by exporting your data to Microsoft Excel or Google Sheets. This is especially handy if you want to blend your GA4 data with data from ad platforms. Some of the more advanced data manipulations you can perform from a spreadsheet include:
- Blending with VLOOKUPs
- Pivoting through your data
- Creating charts and graphs
You will need to use Google Sheets if you plan to:
- Use your spreadsheet tables as data sources for Looker Studio
- Use the CSV File Upload option to move data from Excel to Looker Studio
If you need to pull GA4 data into spreadsheets on a scheduled update basis, consider using Google Sheets with the GA4 Magic Reports add-on.
Scroll down to our March 23rd update on Google Analytics 4 for some tips on how to choose the right report in GA4.

Questions to ask yourself before getting started with GA4 reports
March 23, 2023 update
Choosing the right report in GA4 when you’re first getting started can be a challenge, but it doesn’t have to be. Use the key below to help yourself make the right choice.
What is the long-term need for your report?
If you need to build a simple report that will be frequently accessed, try creating a customized report in the Reports Library.
If you need to build a one-time report for ad-hoc analysis results, try Explore or Excel. Just don’t forget that an Explore report won’t be editable for the others you’ve shared with).
If you need to build a robust, reusable report that will be shared widely, create the report in Looker Studio.
Is the data you’re looking for general and top-level, or is it very specific?
If the data is pretty high-level, you can use reports (pre-built or customized).
If the data is more specific, start with Explore and see if you need to move out of the UI from there.
Do others need to collaborate with you on interacting with this report?
If they don’t need to work on it with you or they only need to be able to look at it one time, use Explore.
If they do need to work on it with you or need to be able to change date ranges, use Looker Studio.
Do you need to recreate the same report across multiple accounts?
If you don’t need to recreate it (or you don’t mind starting from scratch each time), use Explore.
If you do need to recreate it, copying templates is not currently an easy option regardless of the tool you’re using. Working with a GA4-certified digital marketing agency like ROI Revolution can help you navigate some of the more complicated aspects of GA4. To explore how we can help your business utilize GA4 effectively, send a message to our team today.

Figuring out where to start with GA4 tools
March 9, 2023 update
The most important starting point with GA4 attribution is to figure out exactly what questions you have and what data you’ll need in order to answer those questions effectively.
As a great starting point to get some ideas flowing, try the Insights button. Once you have a clear goal in mind, think through your tool options to decide what’s best (see our February 9th update for more on that).
If you’re still not sure where to begin, start by checking for a pre-built report that meets your needs. Not finding what you’re looking for? Try designing a custom report in the Report Library. If at any point you run into barriers with the functionality in Reports, or dimensions and metrics that aren’t available, try Explore.
ROI tip: If you want to pick up where you left off in Reports, or if you find yourself wanting to dig deeper on an existing detail report, there is a somewhat hidden way to do this without starting over! From a detail report, click the icon to Edit comparisons in the top right corner of the report. At the bottom of the right nav that appears, click “Explore” (try refreshing if it is missing). And voila! Now you can start from the same data and begin to dig in deeper.
If Explore’s built-in capabilities just aren’t cutting it, and you know you could get to where you need to be in a spreadsheet, export the report data to Excel (or try the Supermetrics add-on in Google Sheets) and work with it from there.
It’s not easy to keep up on all of the latest updates on Google Analytics 4 and to switch to an entirely new interface for tracking very important data. If you think your business could benefit from having a team of GA4-certified experts by your side, send us a message today.

Google announces that Optimize won’t be offered in GA4
February 23, 2023 update
If Google Optimize is an important part of your marketing analytics strategy, you’ll want to find a replacement solution before this fall. Google has announced that after September 30, 2023, Google Optimize and Optimize 360 will be sunset, as the technologies won’t integrate with Google Analytics 4 (GA4).
Google explains that Optimize “does not have many of the features and services that our customers request and need for experimentation testing.”
So what should you do? First, make sure that you export your historical data before it disappears. As far as being able to split test in GA4, Google will make their APIs publicly available for businesses to be able to integrate their own A/B testing tools with GA4.
If you don’t want to use Google’s APIs, you should eventually be able to utilize a third-party tool with GA. Google is currently testing A/B testing integrations with AB Tasty, Optimizely, and VWO.
Did you know that AB Tasty and ROI Revolution are partners in the digital marketing space? We work together to help brands take their ecommerce customer experience to the next level. Send a message to our team to get connected. You can also check out some of the articles we’re collaborated on below:
- Webinar Replay: Improving Conversions & Elevating Experiences With Data
- 8 Holiday A/B Tests to Boost Your Holiday Ecommerce Growth
- How to Go From Ad-Hoc A/B Tests to a Revenue-Driving Culture of Experimentation
- 3 Personalization Tips to Boost Your Paid Traffic Conversion Rates
There are also ways to track your A/B tests without losing historical data within the GA4 Audiences feature. To ensure you’re set up for success with Google Analytics 4, having an expert by your side is key. If you don’t have that in-house, the certified GA4 experts at ROI Revolution are ready to help. Send a message to our team today to explore how we can help turn your GA4 attribution nightmares into a pleasant dream.

February 9
How to choose the right tool to navigate your GA4 data
GA4 offers multiple ways to analyze and report on data, both via the UI itself and external tools. Keep reading to get an understanding of each tool’s specific value.
GA4 Reports
Reports are aggregated tables of data consisting of overview cards and detail reports designed to give you top-level insights into your data.
GA4 Reports are intended to serve as snapshots and simple tables of your most important data, and are limited in their filtering, segmenting, and drilldown capabilities.
The Report Library can be fully edited and customized to fit your unique needs. You can customize Reports to be arranged into collections of topics designed to surface your most important data. They’re also unsampled and can look back on all historical data, regardless of data retention settings!
GA4 Explorations
GA4’s Explore feature is a collection of advanced data analysis techniques that allow you to explore your data. Unlike Reports, Explorations give you the opportunity to:
- Quickly perform ad hoc queries
- Drill down and sort data
- Add segments and filters
- Export results to other products
Explorations are the best tool to dive deep into your data to pull out actionable insights. However, Explorations are your own work and can’t be collaborated on with other users.
Explore data is subject to sampling and restricted date ranges looking back at either two months or 14 months of data, depending on the property’s data retention settings.
Microsoft Excel or Google Sheets
Explore has its limitations, especially for blending GA4 data with ad platform data. You can take your analysis and Explore data tables one step further by exporting the results to a spreadsheet and performing more advanced data manipulations there. You’ll need to use Google Sheets if you plan to use your spreadsheet tables as data sources for Looker Studio. To move data from Excel to Looker Studio, use the CSV File Upload option.
Google Looker Studio
Looker Studio’s role is similar to what it was for Universal Analytics in that it will continue to be the best resource for data visualization and reporting. Looker Studio is not a good resource for ad hoc queries and most data analysis since building the data sources can be quite complex.
Google BigQuery
BigQuery is a cloud data warehouse platform that opens a world of possibilities with GA4 data, including blending it with customer CRM data, Census data, or Google Trends. BigQuery provides infinite possibilities to query raw GA4 data and build data tables that aren’t possible to achieve in the GA4 UI, and in a much easier and more scalable way than with Google Sheets.
Potential BigQuery use cases include:
- Build user identity graphs
- Calculate lifetime value
- Create custom remarketing lists
- Apply machine learning to build advanced data models and predictive analytics capabilities
- Improve automation and debugging processes
- Retain historical data
- Customize attribution modeling and lookback windows
If you have a novel idea for data reporting and analysis that can’t be done with any of the aforementioned tools, BigQuery just might be your answer.
In our next update, we’ll dive deeper into where to start with determining which tool to use and questions to ask yourself when getting started.
Until then, if you’re feeling overwhelmed by the transition to GA4, know that you’re not alone. The experts at ROI Revolution are dedicated to preparing for the switch and keeping up with the latest updates on Google Analytics 4. In fact, we were one of the first agencies to become a GA4-certified and have migrated over 215 websites to the new platform. If you’re interested in seeing how we can help your brand with the switch to GA4 and GA4 attribution, reach out to our team today.

Deciding where to start with GA4 reports
January 26, 2023 update
With GA4 comes a plethora of choices as to how to go about pulling the data and insights you need, and the user interface may not always be the right choice. The questions below should help reduce confusion and point you in the right direction for everything you need!
Are you looking for a general overview or deeper insights?
A general overview of common metrics is likely best for the Reports section, although you will likely need to build your own collection of reports to get started. Keep in mind that everyone with access can see and access the collections and topics you add.
Digging in for deeper insights most likely won’t be possible with Reports, so proceed to the following questions to decide where you should look instead.
Are you looking to analyze data on the fly or build a robust, reusable report?
Explore is best for deep analysis on the fly, with the ability to easily interact with data to dig deeper, slice and dice in different ways, compare user segments, or visualize data with funnel and path reports.
Robust, reusable reports are most likely better for Data Studio, especially if it needs to be accessible and editable by multiple people (see next question).
Does your report need to be editable by others on your team (including date range edits)?
If it’s just for you, Explore is a perfectly reasonable option. Sharing an Explore report only shares view-level access, so others will not be able to edit, even just to change the date range.
If you need to share the report with other team members, and those people need to have the same ability to edit that you do, Data Studio is likely the way to go.
Sharing Explore reports may be sufficient if you’re sharing the results of a recent one-time analysis you created, but data that needs to be accessed and updated repeatedly should be built in Data Studio.
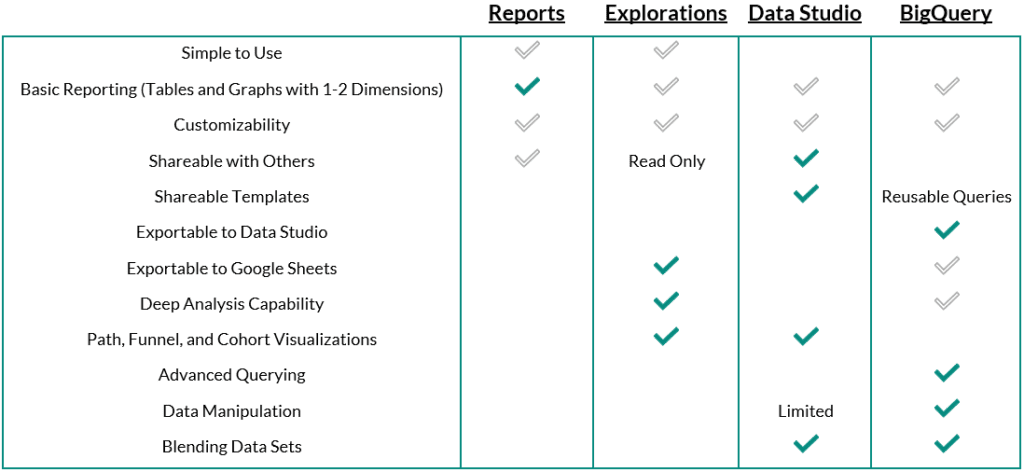
The chart below provides a summary, with recommendations in teal. Start with this chart to decide which tool makes the most sense for each task you are looking to accomplish.
We know that many marketers are feeling overwhelmed about the transition to Google Analytics 4. It’s not just that capabilities are changing – so is the entire interface. Having a team of GA4-certified experts by your side could ease the stress a lot for you. To see how we can help you switch to GA4 smoothly, send a message to our team today.
Customizing your reports in the library
January 12, 2023 update
With Admin access, you can create new collections, topics, and reports, and you can edit any of the existing collections, topics, or reports to fit the needs of your business. For example, if you’re a lead gen site, it might be smart to delete the monetization reports if you don’t track any revenue-generating metrics.
Note: The changes you make to Reports are applied to everyone with access, and it’s not possible at this time to have a private report collection.
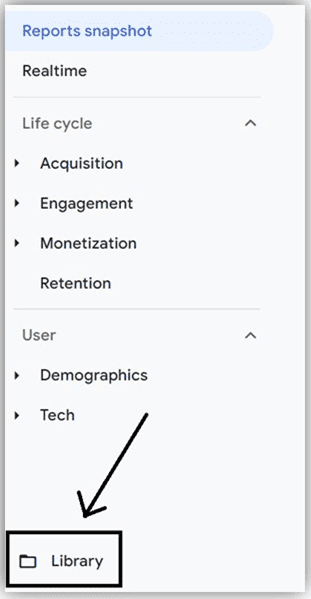
To customize reports, navigate to the Library feature at the bottom of the Reports section. As mentioned above, editing and creating reports requires Admin access, so if you don’t see this option, that means you need Admin access.
Within the report Library, you’ll find all the prebuilt reports we mentioned in our January 5 update (below), and you can click to edit them from there. You can also edit existing reports by clicking the pencil icon in the top right corner of any report.
Building a report is a lot like building a custom report in Universal Analytics, but even more simplified. You can select as many dimensions as you need, and up to 12 metrics.
In your report, your selected dimensions will be provided as dropdown primary dimension options, so secondary dimensions can only be applied outside of the initial report configuration.
Finish out your report by adding dimension-based filters, selecting chart types, and building the summary cards you’ll want to have in your Overview reports. When you’ve finished designing your report, save it and give it a name and description.
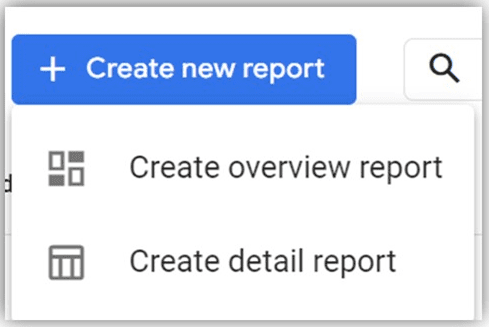
Creating overview reports
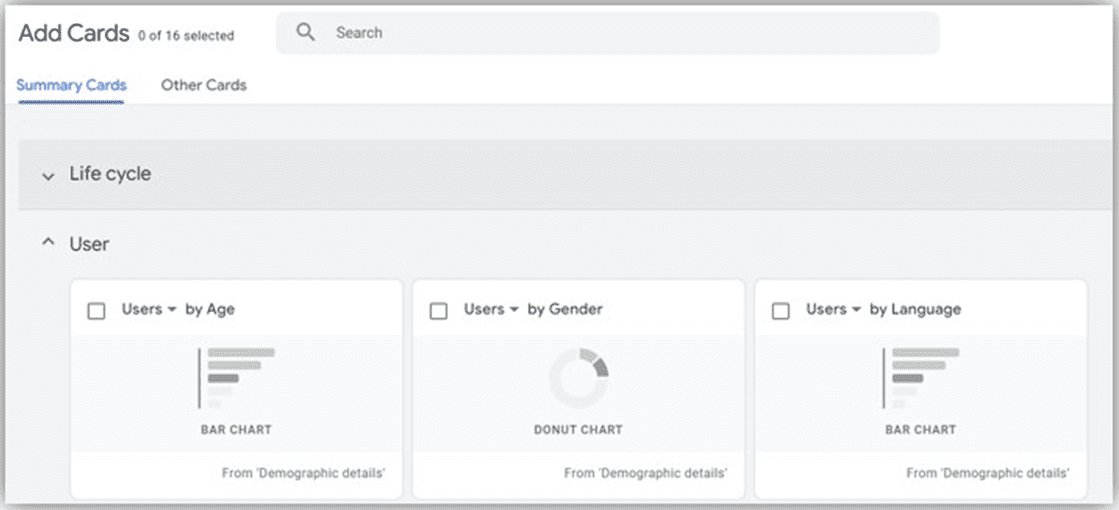
The summary cards you’ll add to your overview reports are created within your detail reports, so make sure not to skip this step when building a detail report. After your topic’s detail reports are complete, you’ll want to create an overview report and select the summary cards you’d like to display in your overview.
Within the report configuration, you’ll be able to expand or collapse collection headers to find the summary cards from your specific collection. You may also find useful cards in the “Other Cards” tab.
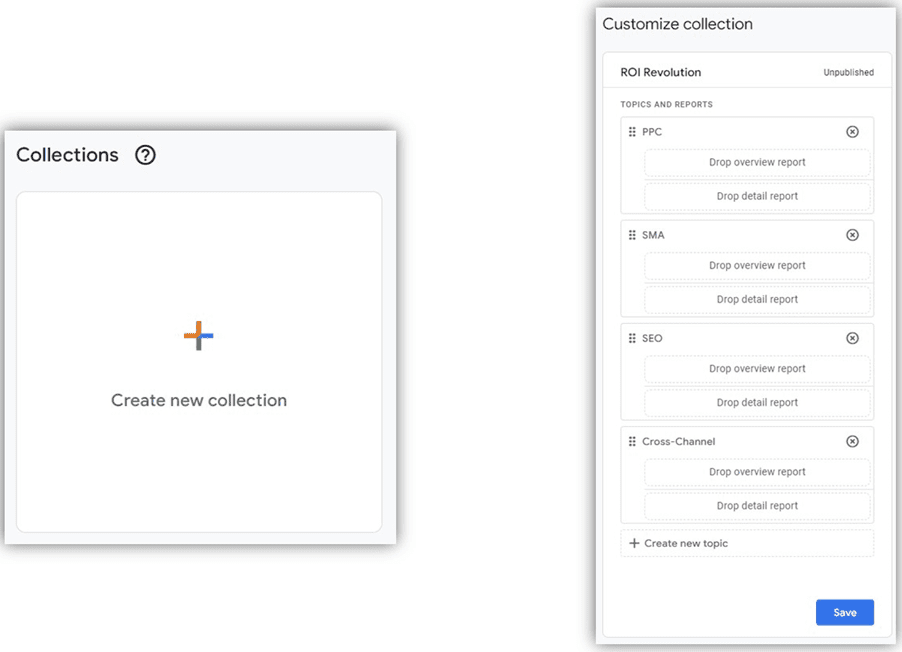
Designing collections and topics
After you finish building all the detail and overview reports for your collection, click “Create new collection.” Once again, you can start from a template or build a blank collection from scratch.
From here, you can drag and drop your reports (provided in a list to the right) into your collection design. When you’re done, click Save and return to the main Library screen.
Publishing a collection
After you’ve finished designing your reports, topics, and collection, you’ll need to publish the collection before it begins showing up in your Reports navigation.
To do this, go to the main Library page, find your collection across the top, click the three dots, and select “Publish.” You will now see the reports in your main Reports lineup (and so will everyone else!). Collections are listed in alphabetical order.
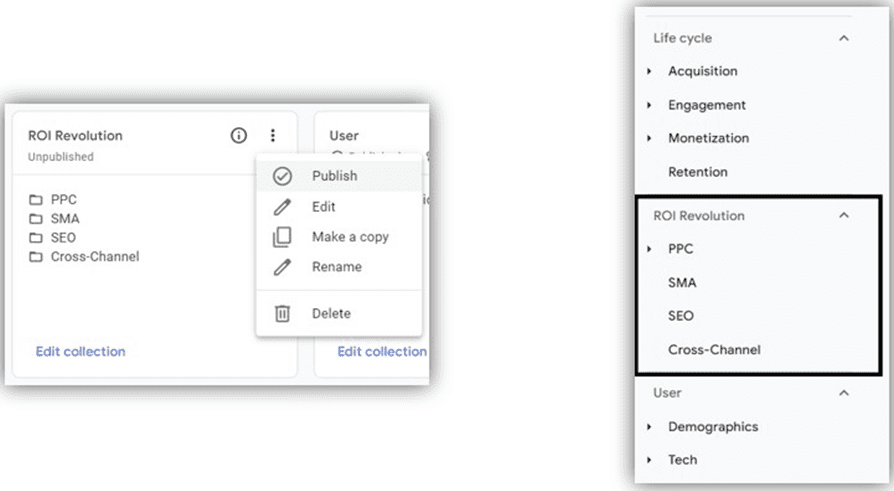
It’s also worth noting that publishing collections and organizing reports into collections and topics is not required. If you save a report without adding it to a collection or publishing that collection, you can still access the report at any time by navigating to the Library screen.
Keep in mind that Reports are very limited, so you should design these to be as top-level as possible. Not all dimensions and metrics are available, so if you run into roadblocks, your report design may be better for Explore or Data Studio. In our next update, we’ll share tips to help you decide which feature is right for your specific needs, so stay tuned!
ROI Revolution is a GA4-certified agency, and our experts have already migrated over 225 websites to the new platform. If you’re dreading the transition or are simply looking for some support with this major change, our experts would be thrilled to relieve the stress for you. Send a message to our team today to connect with our GA4 experts!
Exploring predefined report collections & topics in GA4
January 4, 2023 update
The Life cycle collection of reports in GA4 is predefined to help you break down user activity at each stage of the customer user journey, from acquisition to retention. This collection includes the following topics, each of which houses an Overview report and up to three Detail reports.
Life cycle collection
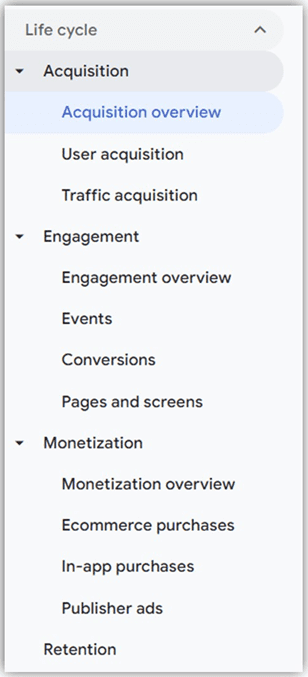
- Acquisition: These reports are all about where traffic originated, both from a user scope (User acquisition) and session scope (Traffic acquisition). These two detail reports are structured the same way, but with different approaches to attribution. You can think of User acquisition as a first-touch model, whereas Traffic acquisition is a last-touch model.Attribution models chosen at the property level are not applied to acquisition reports, as they are tied specifically to Conversion reporting.
ROI Tip: The Acquisition overview report contains a link to a Google Ads campaign report that uses a session-scoped campaign dimension by default. Change your primary dimension to “First user Google Ads campaign” for first-touch data, or use Explore or Data Studio to build a more comprehensive report with data-driven attribution.
- Engagement: These reports highlight the engagement users have with the website or app after they’ve arrived. This collection houses reports on events, conversions, and pages, with metrics like engagement rate and user stickiness.
- Monetization: This topic contains ecommerce reporting as well as additional reports like in-app purchases from mobile apps and ad revenue from publisher platforms like AdMob.
- Retention: Retention is currently a standalone Overview report of sparkline to show how frequently and how long users engage with the website, with users grouped into cohorts.
User collection
The User collection is designed to tell you more about the users engaging with your website or app, such as their ages, interests, and devices.
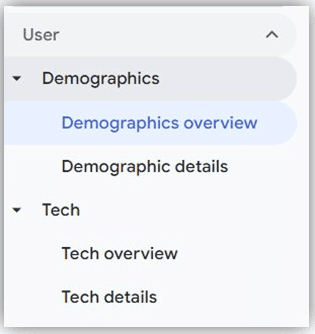
- Demographics: These reports classify users by age, location, language, and gender, along with interests they express through their online browsing and purchase activities.
- Tech: These reports provide details on user platforms, devices, operating systems, and browsers.
We’re excited to help you stay up-to-date with everything you need to know about this major transition. Peruse some of our resources below to build up your knowledge – and if you’d like to partner with our GA4-certified experts to make sure your transition is stress-free and seamless, send a message to our team today!
- How to Set Up Your GA4 Property for Success
- Webinar Replay: Getting More Out of GA4
- ROI Revolution Is Now a GA4 Certified Agency!
- The 411 on GA4: Infographic
- Getting More Out of GA4: Attribution Key Concepts
A breakdown of reports in GA4
December 16, 2022 update
The Google Analytics 4 (GA4) interface is designed with four distinct areas to analyze data:
- Home: Bubbles up relevant information based on your previous behavior in GA4
- Reports: Contains predefined reports to give you top-level insights into your data
- Explore: A collection of advanced data analysis techniques that allow you to uncover deeper insights than what’s possible in Reports
- Advertising: Provides various tools for analyzing multi-channel attribution modeling and conversion paths
In today’s update, you’ll dive deeper into what the Reports section has to offer.
To access GA4 attribution reports, click on “Reports” in the left-hand navigation of your GA4 property.
From here, you can navigate to the Reports snapshot, Realtime reports, or sets of report collections (report group headers) and topics (subsets of reports). The default report collections are Life cycle and User, and topics are the expandable report groups within these collections, such as Acquisition or Demographics. All but the Realtime reports are fully customizable by account administrators.
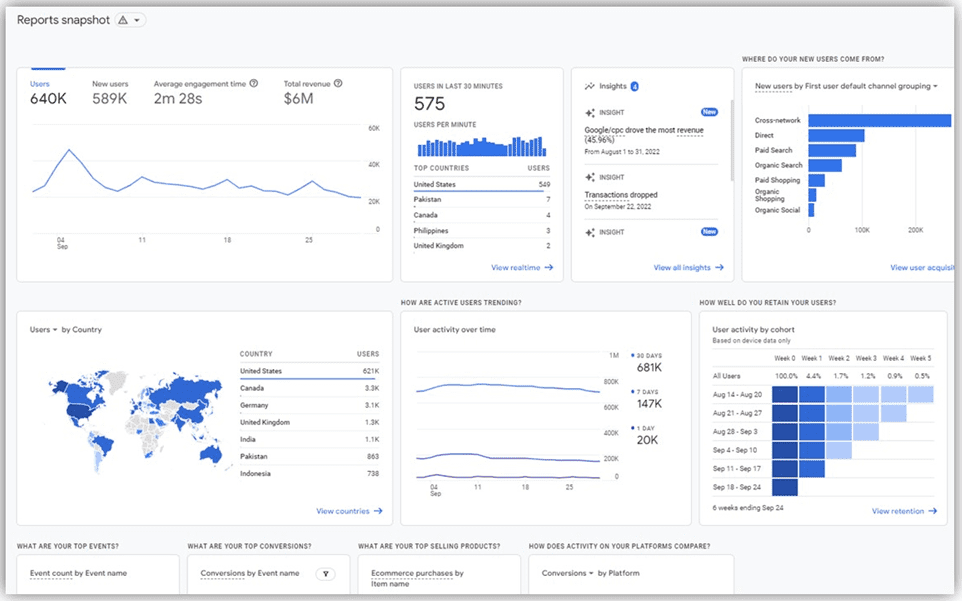
Reports snapshot
This is an overview report that opens by default when you first navigate to Reports, and can contain a collage of any of the summary cards available from any of your Overview reports.
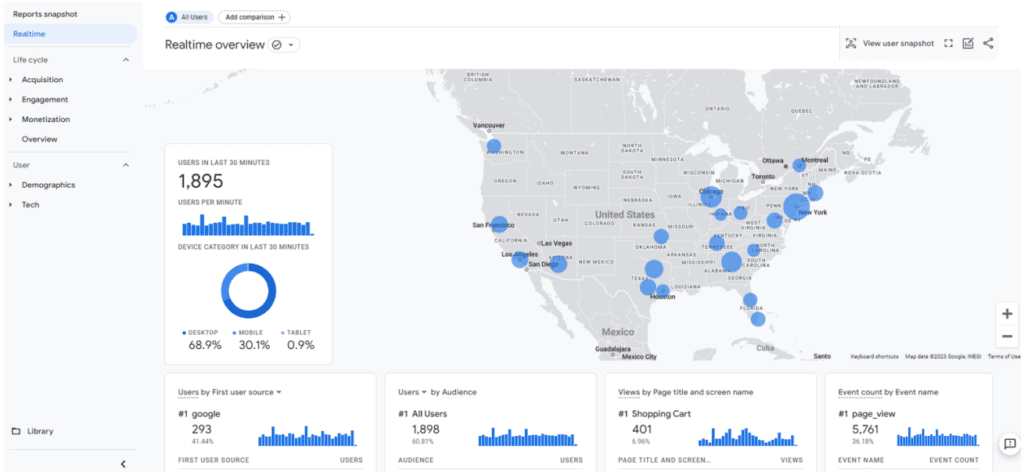
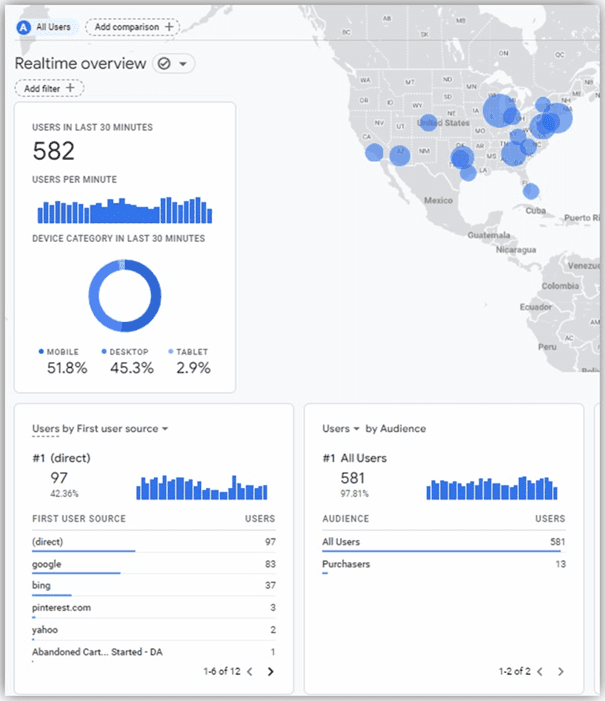
Realtime reports
Realtime reports let you monitor current performance by showing information about the users on your website or app within the last 30 minutes, i.e. users whose sessions have not yet expired. You can apply comparisons to Realtime reports, but the report cards themselves cannot be edited.
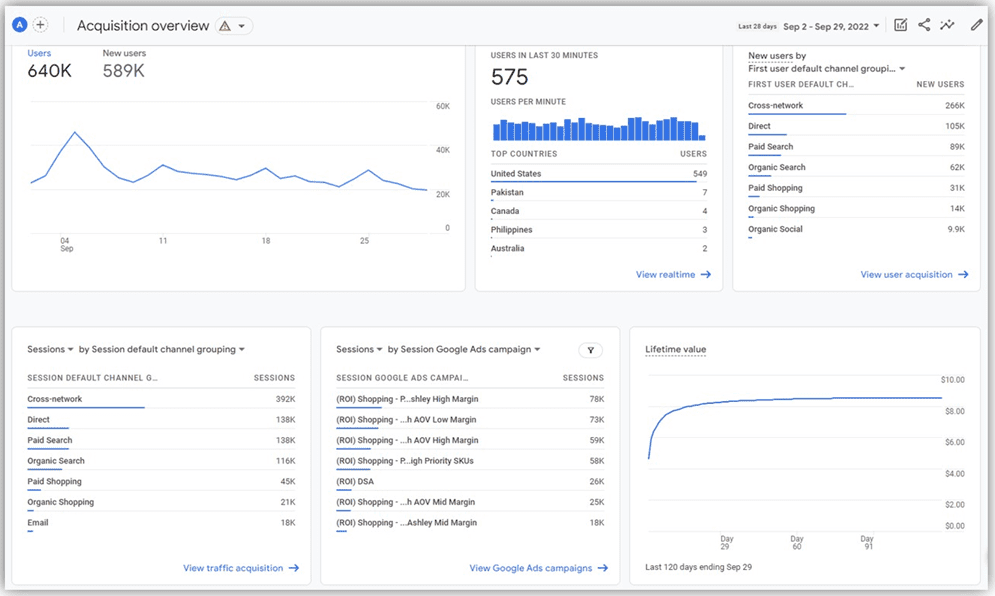
Overview reports
Within Reports, collections contain topics, and each topic typically contains an Overview report. Overview reports are like the Reports snapshot in that they contain summary cards that link to detail reports in the bottom right corner of each card.
Not all linked detail reports are also shown in the left navigation, so going through the Overview report may be the only way to find certain detail reports by default (for example, the Google Ads campaigns report link shown in this Acquisition overview screenshot).
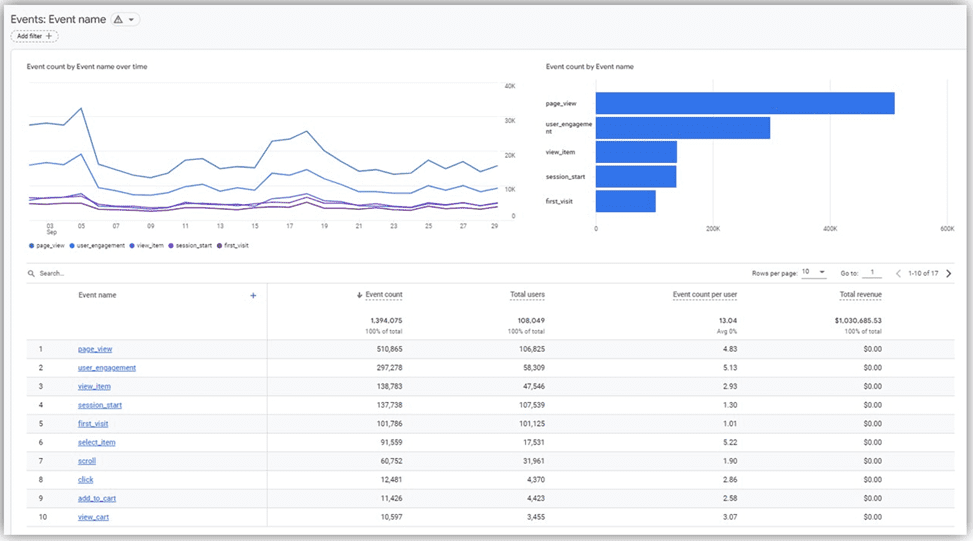
Detail reports
Detail reports are single reports that typically contain a data table, graph, and one additional chart visualization like a bar chart or scatter plot. Data tables in detail reports can show up to 250 rows and can have secondary dimensions and comparisons applied.
Stay tuned for more updates about reports in GA4, including details on the different types of report collections, how to customize GA4 reports to fit your unique needs, how to decide which report to use, and more!
Looking for a more in-depth look into how to use GA4? In our Getting More Out of GA4 webinar replay, you can watch a live walk-through of a GA4 account, plus get an explanation from our analytics experts of attribution models, lookback windows, and data retention in the new attribution platform. Watch the video here.

A quick GA4 Q&A
November 10, 2022 update
The switch to Google Analytics 4 is just under 8 months away. Is your brand ready? There are a few things you should definitely know ahead of time to make the transition as low-stress as possible. Here are a few of the most commonly asked questions about GA4 to help you prepare.
- What is GA4? GA4 is the newest version of Google Analytics that is replacing Universal Analytics.
- When is the switch to GA4 happening? GA4 will replace Universal Analytics on July 1, 2023. At that time, UA will stop collecting new data and GA4 will be required moving forward.
- What is scope in GA4? Scope gives advertisers the ability to see what generated an event or session, and to see where the user who generated the session came from. The 3 main types of scope in GA4 are user, session, and event scope.
- What are attribution models in GA4? An attribution model is a rule, set of rules, or data-driven algorithm that determines how conversion credit is assigned to touchpoints. The types of attribution models in GA4 are data-driven, last click, ads-preferred last click, first click, linear, position-based, and time decay. They are applied to event-scoped dimensions and metrics.
- How long are lookback windows in GA4? The max lookback window in GA4 is 90 days, with additional preset options of 30 or 60 days. GA4 also introduces the concept of acquisition conversion events with preset options of 30 or 7 days (though these are only applicable to first_open and first_visit events).
- How long is data retained in GA4? GA4 allows up to 14 months of data retention with an additional 2-month option.
- What about Universal Analytics 360? Universal Analytics 360 is the enterprise version of the platform. It includes more complex and unique measurement capabilities and allows up to 50 months of data retention instead of just 14. Most notably, 360 properties will be migrated on July 1, 2024, instead of 2023.
ROI Revolution is a GA4-certified agency ready to help your brand track sales with high accuracy and low stress in the new platform. If your brand is looking to offload some of your concerns, send a message to our team today to see how we can relieve your worries about GA4 attribution.

Getting More Out of GA4: Webinar Replay
October 27, 2022 update
Hopefully you’ve done the hardest part of transitioning to GA4 and beat the deadline to implement year-over-year tracking. But do you know where to start when it comes to understanding your data in the new platform?
In this webinar replay video, dive into the next generation of Google Analytics. In addition to giving you a live walk-through of a GA4 account, our analytics experts will help you understand concepts like:
- Attribution modeling: Discover new features in GA4 that allow you to choose the most appropriate model for your business and view conversion data through multiple attribution lenses at once.
- Lookback windows: Understand what they are and what shorter windows in GA4 mean for your data.
- Data retention: Learn what you can do today to maximize your year-over-year data in GA4.
- The importance of scope: Explore how scope contextualizes metrics and pairs with attribution models for insightful reporting.
Ready or not, GA4 attribution will be the required path forward for marketers as of July 1, 2023. Watch the video to get ahead of the game when it comes to understanding your data in GA4.

4 keys to set up GA4 for success
October 13, 2022 update
Picture this: You’ve migrated your Universal Analytics property over to GA4 and have basic year-over-year tracking set up. Now what? Taking a thoughtful approach to tracking and reporting design in GA4 now will empower you to truly take advantage of all the new features GA4 has to offer.
When setting up your GA4 property for success, there are four key GA4 attribution concepts you’ll want to consider.
- Event tracking: For most ecommerce organizations, pageview and purchase tracking are the bare minimum. These data points likely fall short of the tracking you have set up in Universal Analytics. Events have conceptually changed in GA4, and there are a few considerations to make before mapping them into your new property.
- Custom dimensions and metrics: These are important data points to track membership status, page types, and other details that Google Analytics does not provide by default. While these are still available in GA4, it is vital to review what is still necessary and how custom definitions have changed.
- Standard report customization: If you’ve started to dabble in GA4, you may have noticed that the standard reports and navigation structure contain elements that may not be directly applicable to your business. The good news is that GA4 makes this completely customizable.
- GA4 property settings: It can be confusing to determine what property-level customization settings apply to your organization vs. what might cause issues down the line if left unaddressed.
Want to dive deeper into these 4 keys to setting up GA4? Read our blog on how to set up your GA4 property for success.

Updates on Google Analytics 4 data retention
October 10, 2022 update
Data retention is one of the main factors that will change with the transition from Universal Analytics to Google Analytics 4. Data retention refers to the amount of time before user-level and event-level data stored in GA4 is automatically deleted from Analytics servers.
In GA4, this only affects Explorations and does not affect any standard aggregated reporting. The recommended event data retention setting is 14 months to allow for year-over-year reporting on user and event-level data.
Data retention will be different in GA4 compared to Universal Analytics. One major change is that Universal Analytics allows for indefinite data retention, while GA4 allows up to 14 months of data retention.
UA offers 14-, 26-, 38-, and 50-month options, while GA4 also offers a two-month option.
Lastly, in UA, a change in the retention setting does not affect data that was captured while the old setting was applied. In GA4, a change in the retention setting also applies to data already collected.
The PPC and analytics experts at ROI Revolution are GA4-certified to make sure your brand is ready to track your sales with high accuracy in the new platform. Making the switch effectively can take a lot of time and bring a lot of stress. If your brand is looking to offload some of your concerns, reach out to our team today to see how we can make the transition stress-free and accurate.

ROI Revolution becomes GA4-certified!
October 5, 2022 update
As part of setting our clients up for success with GA4 attribution, ROI Revolution was one of the first agencies to earn a GA4 certification. We earned our certification within three weeks of the exam being released.
With Universal Analytics going away in July 2023, brands that didn’t transition before July 2022 won’t be able to track year-over-year data in GA4. ROI Revolution’s dedicated Analytics team has been working diligently to onboard clients to GA4 tracking and make GA4 their single source of truth, and we’ve completed GA4 tracking setups for over 200 websites!
We’ve worked with all of our clients on getting tracking implemented in GA4, pushing them through each stage of tracking implementation and ensuring that they actively analyze GA4 to ensure our clients have everything they need for tracking and their data looks as expected.
We provide recommendations on how to utilize GA4 features to your advantage, including how GA4 integrates with other Google products like Merchant Center, Optimize, Search Console, BigQuery, and Data Studio.
“Our goal is not to just get by with the transition to GA4 and do the bare minimum to be okay when it changes, but to really take advantage of the opportunities to help our clients make the most out of GA4.” – David Austin, VP of Technology, ROI Revolution
ROI’s technology team has also built out a proprietary tool for offline conversion tracking in GA4. Our internal RevolutionSuite technology empowers us to not only set up accurate GA4 attribution and tracking for our clients but also to provide strategic, data-driven insights.
In order to ensure you have the best ad performance, you need to have the best data. GA4 is the future of tracking – and you should have a great partner with you to go along with it.
If you’re considering making the switch to a new agency, the transition to GA4 isn’t something you’ll have to stress about with ROI Revolution. Our experts are dedicated to being on top of all the updates on Google Analytics 4, and are well equipped to effectively handle GA attribution models, data retention, reporting, tracking, and more so that you have a smooth transition to GA4.
Reach out to our team today to explore how we can ensure your brand has a smooth transition to GA4.

Scope & lookback windows in GA4
September 9, 2022 update
Scope describes the extent to which a metric or dimension is applicable in GA4. It allows advertisers to see what generated an event or a session and then zoom out to see where the user came from.
There are three main types of scope in GA4 reporting, each with an assigned attribution model that is used when a dimension of the corresponding scope is applied to a report:
- User scope: First non-direct interaction model (e.g. first user Google Ads campaign)
- Session scope: Last non-direct interaction model (e.g. session Google Ads campaign)
- Event scope: The attribution model selected in the property settings (e.g. Google Ads campaign)
Lookback windows are one of the main offerings that will change with the switch from Universal Analytics to GA4.
Lookback windows dictate how far back in time Google Analytics will consider an event for attribution credit. Once a lookback window is determined, the attribution model is applied within that timeframe. Scroll down to our last update for more on GA4 attribution models!
The key differences with GA4 lookback windows are:
- Maximum lookback window of 90 days – compared to Universal Analytics at two years
- Offers preset options of 30, 60, and 90 days – compared to Universal Analytics with full down-to-the-minute customization
- Introduces concept of acquisition conversion events with preset options of 30 or seven days
As with Universal Analytics, changes to lookback window are not retroactive in GA4.

What you need to know about GA4 attribution models
August 30, 2022 update
In GA4 reporting, an attribution model can be a rule, a set of rules, or a data-driven algorithm that determines how credit for conversions is assigned to touchpoints on conversion paths.
In all attribution models, direct traffic is ignored and isn’t considered for attribution credit unless the entire conversion path is made up of direct visits.
Let’s explore the different types of GA4 attribution models!
- Data-driven: Disseminates fractional conversion credit based on data for each conversion event – organic, paid search, email, or direct. This model uses actual data from your account to determine the best fit attribution credit for each click interaction or touchpoint.
- Last click: Attributes 100% of conversion value to the last channel the customer clicked through before converting.
- Ads-preferred last click: Attributes 100% of the conversion value to the last Google Ads channel that the customer clicked through before converting.
- First click: Gives all credit for the conversion to the first channel that a customer clicked before converting.
- Linear: Distributes the credit for the conversion equally across all the channels that a customer clicked before converting.
- Position-based: Attributes 40% credit to the first and last interaction, with the remaining 20% credit distributed evenly to the middle interactions.
- Time decay: Gives more credit to the touchpoints that happened closer in time to the conversion. Credit is distributed using a seven-day half-life, meaning that a click eight days before a conversion gets half as much credit as a click one day before a conversion.
Book a Meeting to Achieve Excellence With Google Analytics 4
ROI Revolution has a team of experts dedicated to analytics. Being able to adapt to change before it arrives means that we’re able to help brands like yours take serious advantage of all of the capabilities the new platform has to offer. To explore the difference that comes with having a guide you can trust, book a meeting with our team today!
Scroll to the top of this blog.
Sources
- Google Analytics Implementation Guide & Solutions, Google Analytics Report Automation (Magic Script).
- Google Analytics Help Blog, [GA4] Apply comparisons to reports.
- Google Analytics Help Blog, [GA4] Topics.
- Google Analytics Help Blog, [GA4] Collection.
- Google Analytics Help Blog, [GA4] Realtime report.
- Google Analytics Help Blog, [GA4] Reports snapshot.
- Google Analytics Help Blog, [GA4] Get started with Advertising.
- Google Analytics Help Blog, [GA4] Get started with Explorations.
- Google Analytics Help Blog, [GA4] Understanding Google Analytics Reports.
- Google Analytics Help Blog, [GA4] About the Home page.
- Google Analytics Help Blog, [GA4] Customize report navigation.