


Google Analytics 4 (GA4) offers multiple techniques to analyze and report on data, both within the UI itself and in external tools. Read this blog to gain an understanding of each GA4 tool’s value and where to begin when starting out on any given task in GA4.
GA4 Reports
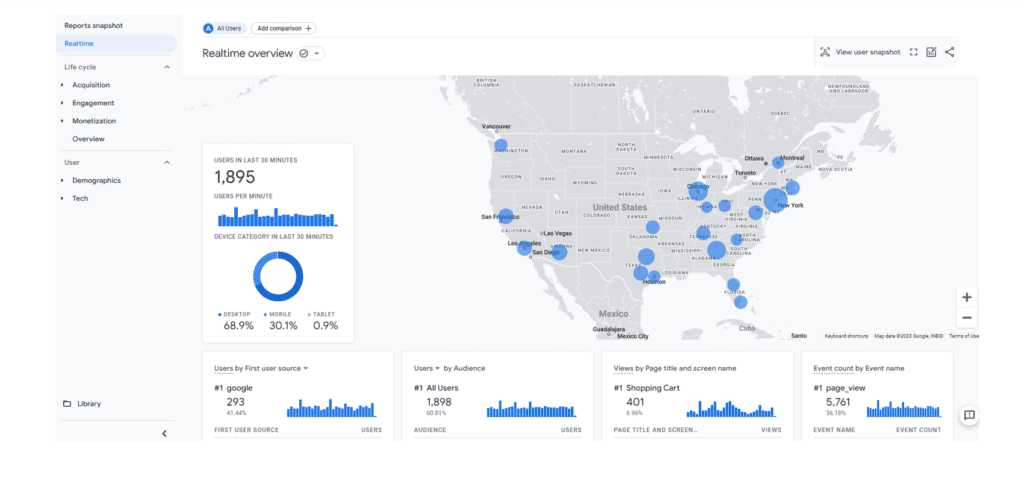
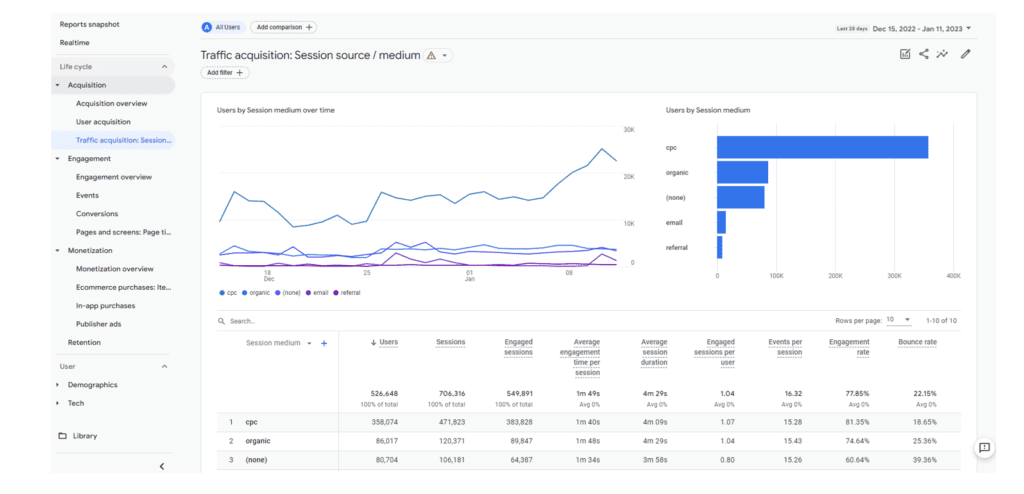
Reports are aggregated tables of data consisting of overview cards and detail reports that are designed to give you top-level insights into your data. Unlike in Universal Analytics, GA4 Reports are not designed to be heavily sliced and diced for deep analysis.
They are intended to serve as snapshots and simple tables of your most important data, and are limited in their filtering, segmenting, and drilldown capabilities. A big advantage of Reports is that the Report Library can be fully edited and customized to fit your unique needs, which was never possible with Universal Analytics.
Reports can be custom arranged into collections of topics designed to surface your most important data. They’re also unsampled and can look back on all historical data, regardless of data retention settings.
Don’t forget to check the Home screen for Analytics Insights! Insights is a set of GA4 features that uses machine learning and custom configurations to help you understand and act on your data with ease.
Looking for more resources on GA4 Reports? Look no further than our GA4 webinar series:
GA4 Explorations
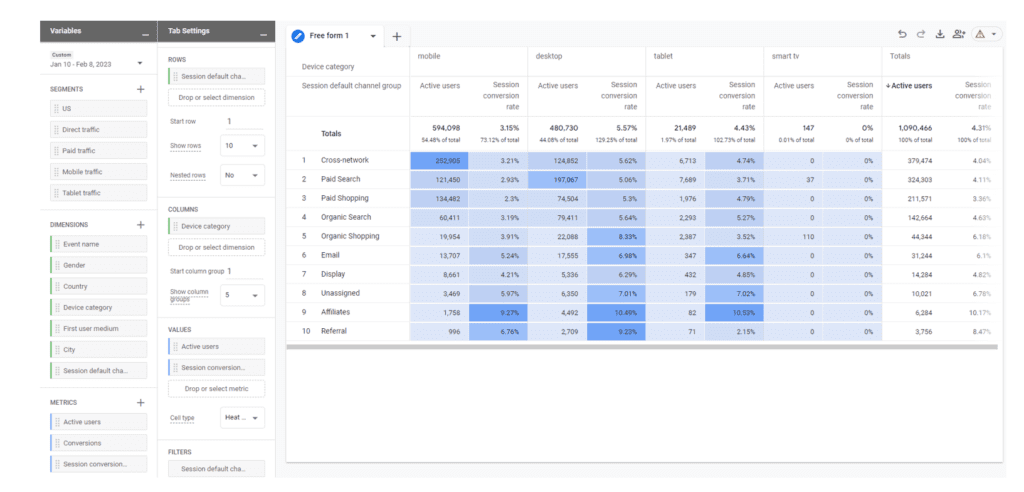
The Explore feature of GA4 is a collection of advanced data analysis techniques that allow you to do just that – explore your data. Unlike Reports, Explorations give you the opportunity to quickly:
- Perform ad-hoc queries
- Drill down and sort data
- Add segments and filters
- Export results to other products
Explorations are the best GA4 tool to dive deep into your data and pull out actionable insights. However, Explorations are your own work and can’t be collaborated on by other users.
Explore data is also subject to sampling and restricted date ranges looking back at either two months or 14 months of data, depending on your property’s data retention settings.
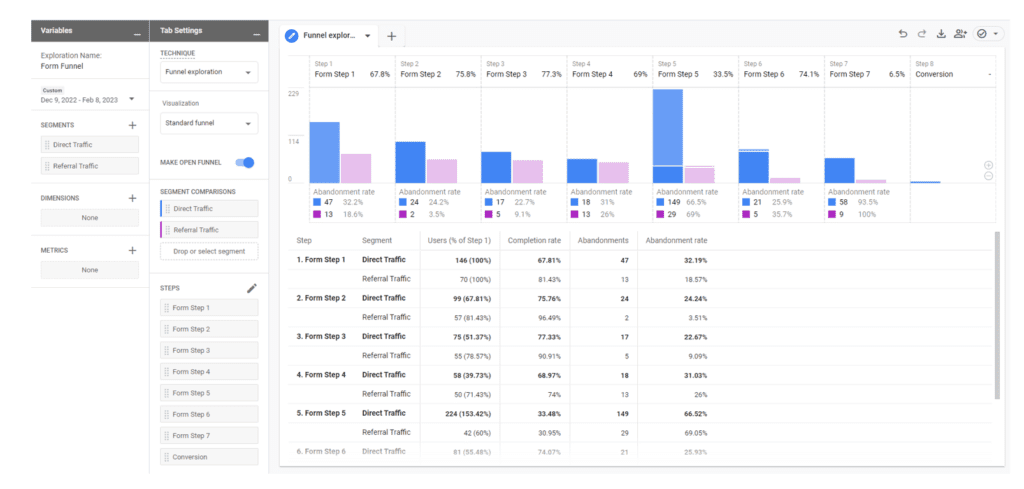
Be sure to expand your data analysis capabilities by trying out techniques beyond free-form tables, such as Funnel and Path explorations, Segment overlaps, Cohorts, and User Lifetime reports.
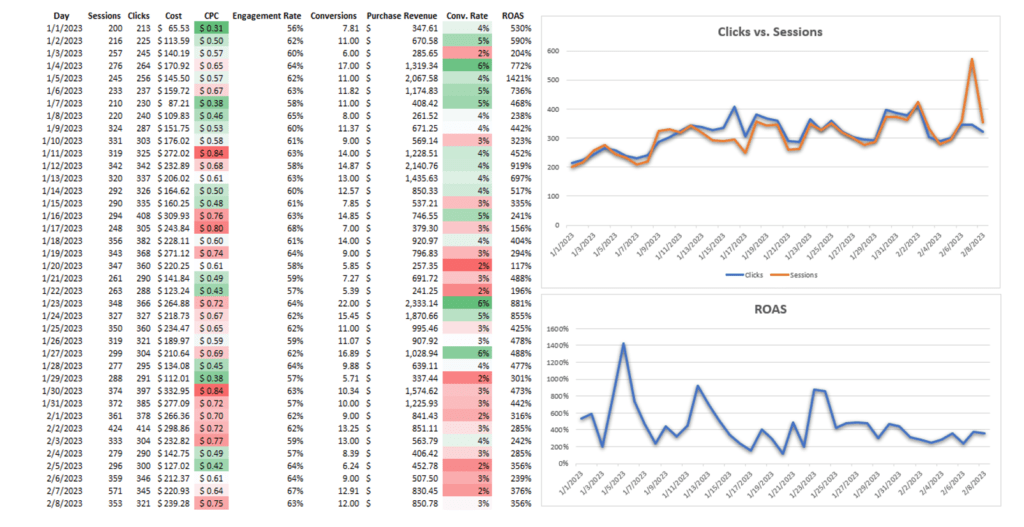
Spreadsheets
Even Explore has its limitations, especially when it comes to blending GA4 data with data from advertising platforms.
You can take your analysis and Explore data tables one step further by exporting the results to a spreadsheet and performing more advanced data manipulations from there, such as blending with VLOOKUPs, pivoting through your data, and creating charts and graphs.
ROI Tip: If you need to pull GA4 data into spreadsheets on a scheduled update basis, try using Google Sheets with the GA4 Magic Reports add-on. You will also need to use Google Sheets if you plan to a) use your spreadsheet tables as data sources for Looker Studio or b) use the CSV File Upload option to move data from Excel to Looker Studio.
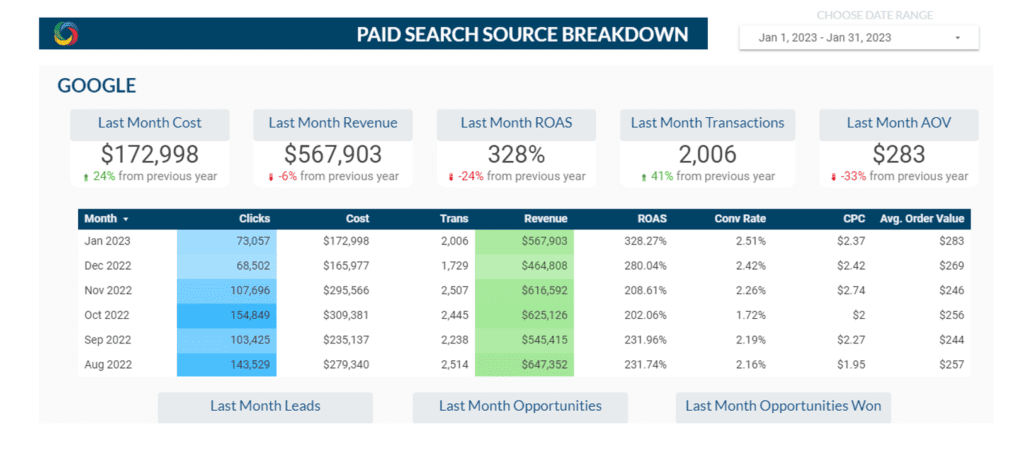
Google Looker Studio
Looker Studio’s role is similar to what it was for Universal Analytics in that it will continue to be the best resource for data visualization and professional reporting.
When building your own reports, be careful to consider scope compatibilities and create data source blends as needed to pull in ad platform metrics.
Looker Studio is not a good resource for ad-hoc queries and most data analysis since building the data sources can be quite complex.
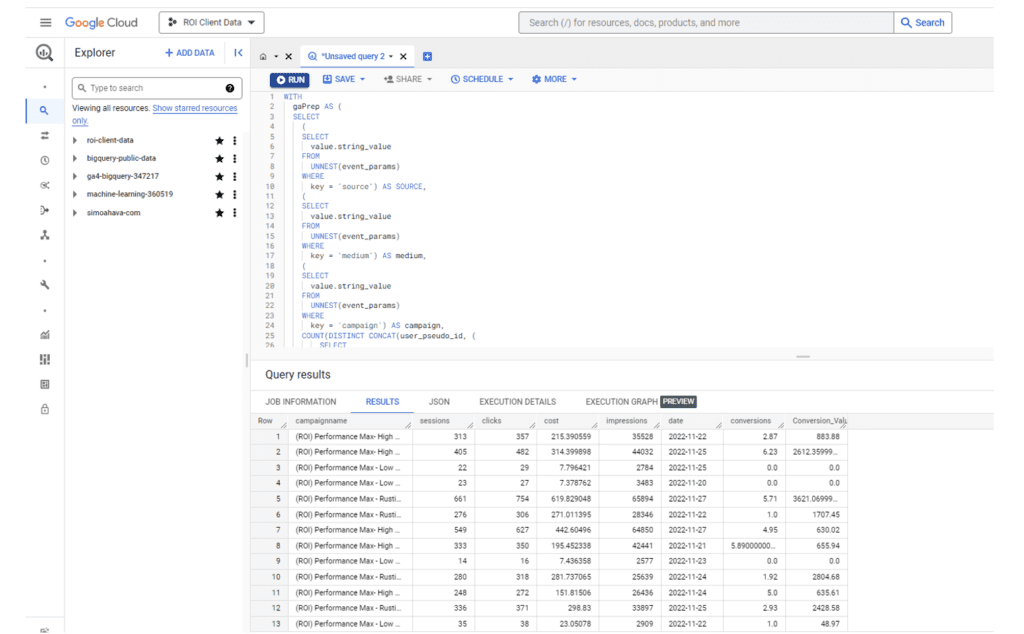
Google BigQuery
BigQuery is a cloud data warehouse platform that enables a world of possibilities with GA4 data, such as blending it with customer CRM data or publicly available datasets (for example, Census data and Google Trends).
BigQuery provides infinite possibilities to query raw GA4 data in order to build data tables. These data tables wouldn’t be possible to achieve in the GA4 UI, and they’re much easier and more scalable with BigQuery than with spreadsheets.
Potential BigQuery use cases could be:
- Build user identity graphs
- Calculate lifetime value
- Create custom remarketing lists
- Apply machine learning to build advanced data models and predictive analytics capabilities
- Improve automation and debugging processes
- Retain historical data
- Customize attribution modeling and lookback windows
- And more!
If you have a novel idea for data reporting and analysis that can’t be done with any of the aforementioned GA4 tools, send a message to our team to learn more about how our Analytics offerings can help you access new insights!
Figuring Out Where to Start With GA4 Tools
The most important starting point when you open GA4 is to figure out exactly what questions you have and what data points you’ll need in order to answer those questions effectively.
As a great starting point to get some ideas flowing, try the Insights button, which can be accessed anywhere you see this icon in the top right:
[Screenshot]
Once you have a clear goal in mind, think through your GA4 tool options. Use what you read above to decide what’s best.
If you’re still not sure where to begin, walk through the steps below:
- Start with checking for a pre-built report that meets your needs. If you don’t find one…
- Try to design a custom report in the Report Library. If at any point you run into barriers with the functionality in Reports, or dimensions and metrics that aren’t available…
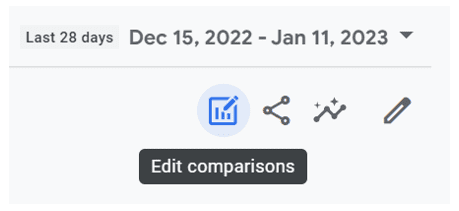
- Try Explore. If you want to pick up where you left off in Reports, or if you find yourself wanting to dig deeper on an existing detail report, there is a somewhat hidden way to do this without starting over.
- From a detail report, click the icon to Edit comparisons in the top right corner of the report:

- At the bottom of the right navigation window that appears, click “Explore” (try refreshing if it is missing):
- Voila! Now you can start from the same data and begin to dig in deeper.
- If Explore’s built-in capabilities just aren’t cutting it and you know that you could get to where you need to go in a spreadsheet…
- From a detail report, click the icon to Edit comparisons in the top right corner of the report:
- Export the report data to Excel (or try the GA4 Magic Reports add-on in Google Sheets) and work with it from there. If you’re still dreaming big and trying to build something very complex that seems outside the bounds of typical spreadsheet manipulations…
- Look for opportunities to advance your data capabilities with BigQuery.
Questions to Ask Yourself When Getting Started With GA4 Tools
What is the long-term need for my report?
If it’s a simple report that will need to be frequently accessed, try creating a customized report in the Reports Library.
If it’s a one-time report of ad-hoc analysis results, try Explore or a spreadsheet (just don’t forget that an Explore report won’t be editable for others you’ve shared it with).
If it’s a robust, reusable report that is shared with other teams, create the report in Looker Studio.
Is the data I’m looking for general and top-level or very specific?
If it’s general, use Reports (pre-built or customized).
If it’s specific, start with Explore and see if you need to move out of the UI from there.
Do others need to collaborate with you on interacting with this report?
If the answer is no, they don’t need it, or they only need to be able to look at it this one time, use Explore.
If the answer is yes, they need to work on it with you or be able to change date ranges, use Looker Studio.
Do you need to blend your data with more data sources?
If the answer is no, use Reports, Explore, or spreadsheets.
If the answer is yes, Looker Studio may be an option for simple data blends. BigQuery is likely the better choice for sustainable, scalable, and reliable data.

Tying It All Together: Which GA4 Tool Should You Use?
If you feel overwhelmed by the transition to GA4, you’re not alone. There are many ways to leverage GA4 tools to analyze your data. The platform is an entirely new way to track and analyze your most important data, and being able to leverage it to meet your goals is crucial.
If you think your business could benefit from having a team of GA4-certified experts by your side for this new journey, send a message to our team today.
Click here to download this content as a PDF.
Sources
- Google Analytics Help Blog, [GA4] Understanding Google Analytics Reports.
- Google Analytics Help Blog, [GA4] Customize detail reports.
- Google Analytics Help Blog, [GA4] Analytics Insights.
- Google Analytics Help Blog, [GA4] Funnel exploration.
- Google Analytics Help Blog, [GA4] Path exploration.
- Google Analytics Help Blog, [GA4] Segment overlap.
- Google Analytics Help Blog, [GA4] Cohort exploration.
- Google Analytics Help Blog, [GA4] User lifetime.
- Google Workspace Marketplace, GA4 Magic Reports.
- Google Looker Studio Help, Upload CSV files to Looker Studio.
- Google Analytics Help Blog, [GA4] Analytics Insights.