


Have you ever wondered how you can take your brand’s SEO to the next level? If you have an in-house SEO or marketing team that handles your on-site optimization, or even if you do it yourself, you’re likely already familiar with Google Analytics. But are you also actively using Google Search Console (formerly, Google Webmaster Tools)? If not, you’re missing out! Google Search Console (GSC) is a free tool created by Google to help you analyze and diagnose issues on your site. In this article, discover how you can set up Google Search Console to elevate your brand’s SEO.
How to Set Up Google Search Console
To get started, you’ll need to decide if you want to set up a domain property (example.com) or a URL prefix property (https://www.example.com).
If your site has multiple subdomains (“blog.”, “ca.”, etc.), you’ll probably want to use a domain property to capture all URL possibilities. However, if you have multiple subdomains but you only want to track one (for example, the “www”), then you’ll want to use a URL prefix property.
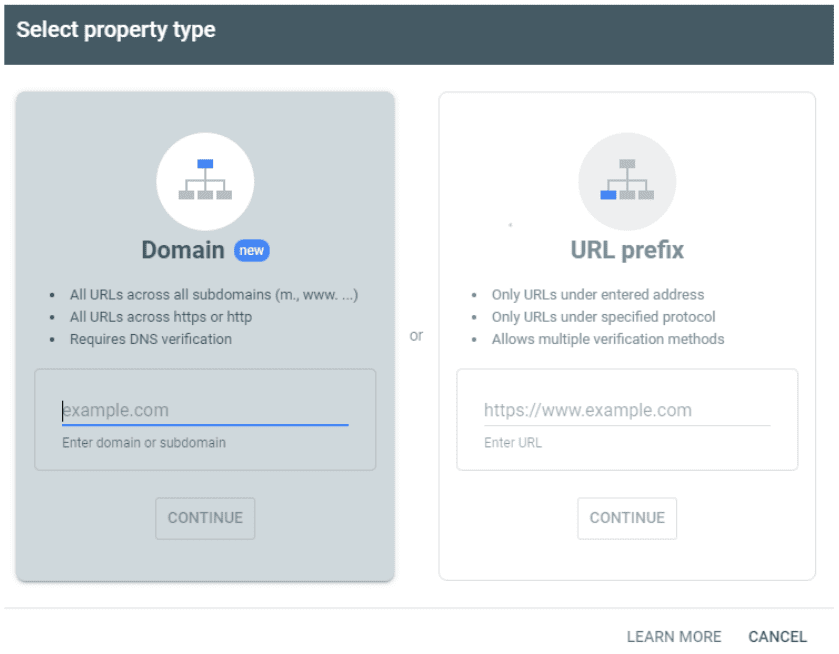
ROI Opportunity | If ever you replatform and change from “www” to “https://example.com” without the “www” (some platforms may force this change automatically), you’ll want to have a domain property configured to ensure historical data is available. It is often easiest to begin with a domain property, so you’ll always have the full range of data available to you.
How to Set Up Google Search Console Top Reports for SEO
Once you’re set up and verified (GSC will provide instructions on how to do that), it’s time to get your feet wet and dig into the top reports and sections of Google Search Console we recommend using for SEO.
Performance Reports
The Performance section of Google Search Console can be extremely helpful to see both gains and losses in terms of keywords (queries) and landing pages on your site, on both search results and Google’s Discover feed.
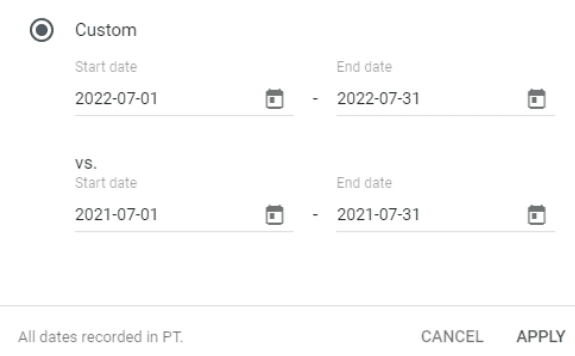
At the top of this page, choose the date range you want to look at. Usually, we use the “compare” tab to select a year-over-year or period-over-period timeframe to review.
Use the “Custom” selector to choose specific dates to look at:
Once you’ve chosen your dates, you will see information for total clicks, total impressions, average CTR (click-through rate), and average position:
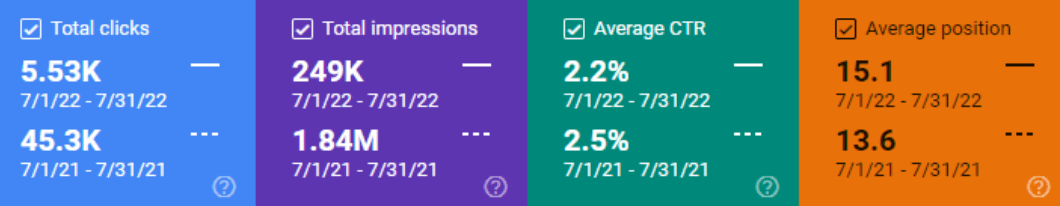
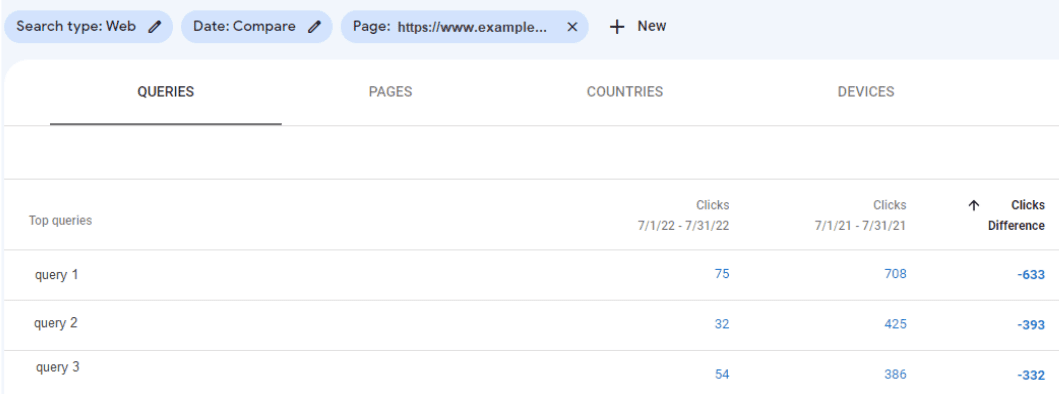
We like to start with total clicks and total impressions (blue and purple blocks) to see top declines and improvements.
Diagnosing Performance Issues
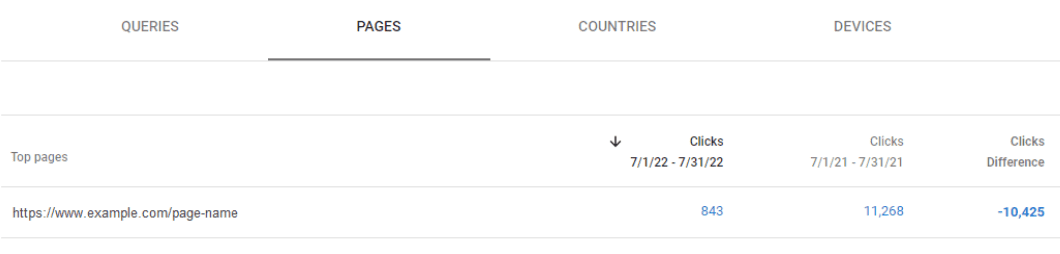
In the screenshot above, you can see clicks and impressions have decreased dramatically. If you don’t already know what could be causing this extreme variance (e.g. a replatform, URL changes, etc.), you should dive into each to see which queries and/or pages were responsible for the largest drops, sorting by click difference or impression difference.
When looking at a page with a substantial drop, click on the page in the list to drill down to just that page.
Then, click the “Queries” tab to see which queries did or did not drive clicks (or impressions) to that page. This is how you can see what is no longer driving traffic or aiding in visibility, and you may be able to determine why that is the case.
At this point, you could also turn on the average CTR and/or average position blocks to see if that information helps you figure out why pages or queries have gained or dropped. Remember, the closer to position 1, the better, for average position.
Additionally, be sure to check the search engine results pages (SERPs) to see if any new features (maps, local packs, ads, image carousels, People Also Ask, etc.) are pushing your entry farther down the results page or if competitors are creeping up and taking your spot.
Index: Pages
Previously called the “Coverage” report, “Pages” is the new name for the section where you will find which pages are indexed and which ones are not.
Scrolling towards the bottom of this page, Google Search Console has made it significantly clearer in this newly named report which pages are not indexed and what is causing the lack of indexation.
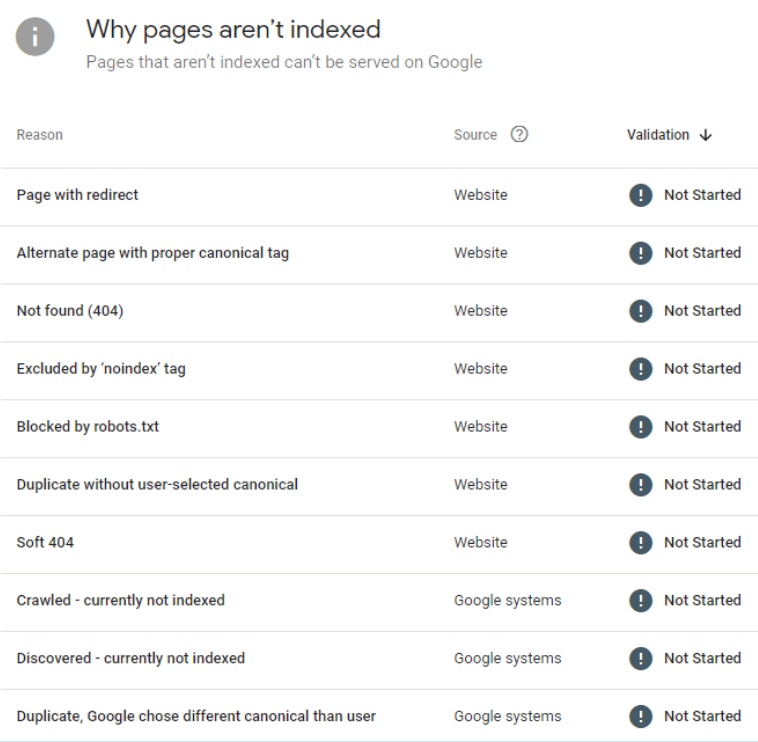
To learn more about each of these errors and what they mean, check out Google Search Console Errors: How to Find and Fix Them on Your Site.
Index: Video Pages
This is a newer report to Google Search Console and helps you identify any videos on your site and whether they are ranking in the SERPs. If they aren’t ranking, you can see why and request validation once changes are made on your site.
Even if you have multiple videos on a page, Google has stated it will only index one video per page.
Index: Sitemaps
Most SEOs and website owners know that it is best practice to have sitemaps on your site. This includes both an HTML sitemap (for users and assistive devices) as well as an XML sitemap (for search engines). Did you know you can submit your XML sitemap in GSC to make it easier for Googlebot to find, crawl, and index the various pages on your site?
Be sure to take advantage of this simple, yet effective, opportunity. All you need to do is copy and paste the URL of your XML sitemap (oftentimes “https://www.example.com/sitemap.xml”) and click the “Submit” button.
Once your XML sitemap is successfully submitted and read by Googlebot, you can click into it and see if there are any issues associated with it via “See Index Coverage” on the top right of that screen.
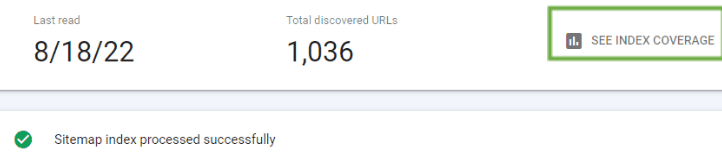
This will bring you back to the Pages report, filtered down to only XML sitemap URLs.
Experience Reports
Google Search Console’s Experience reports identify issues that a user may have when interacting with your site, including in terms of Core Web Vitals (CWV), page experience, and mobile usability.
Since Core Web Vitals are now a ranking signal, both on mobile and desktop, you’ll want to pay extra attention to these reports and make changes, as needed, to ensure your site passes each of the three primary assessments (Largest Contentful Paint – LCP, First Input Delay – FID, and Cumulative Layout Shift – CLS). These GSC reports show how your site performs for each metric using real-world data. To test individual pages and determine what needs optimization, we recommend using Google’s PageSpeed Insights or running a Lighthouse report within your browser.
Enhancement Reports
If you use Structured Data Markup on your site (you should!), you’ll want to pay attention to this section of Google Search Console. It details your use of Schema markup in terms of breadcrumbs, FAQ, how-to, logos, product pages, videos, and any issues with that markup. As a reminder, Structured Data Markup is not an SEO ranking signal, but it can help your pages stand out in search results. Read more about structured data for Google here.
Security & Manual Actions
One of the worst things that can happen to a site is to receive a manual action from Google. This penalty means your pages are out of compliance with Google’s quality guidelines; often due to attempts to manipulate or trick the search engines. As Google states:
“If your site has a manual action, some or all of that site will not be shown in Google search results.”
You will find this information in the Manual Actions section of GSC. Be sure to fix the issue(s) on all affected pages of your site. Then, you can request a reconsideration review. This review can take anywhere from a few days to several weeks or months, and Google will keep you informed via email.

Tying It All Together: How to Set Up Google Search Console to Improve Your Brand’s SEO
Now that you’re familiar with our SEO team’s most frequently used reports in GSC, take this information and apply it to improve your brand’s SEO. Don’t have the time to review all these reports regularly or want help digging in and diagnosing issues? We’re happy to help! Get in touch with our team of experts to see how we can take your brand’s SEO to the next level.
Sources
- Google Search Console, Performance Overview.
- Search Engine Journal, Google I/O Search Console Update: New Report For Indexed Videos.
- Google Search Central Blog, Timeline for bringing page experience ranking to desktop.
- Search Engine Journal, Google Page Experience Update – Desktop Rollout Complete.
- Google, PageSpeed Insights.
- SEMrush Blog, How to Use Google Lighthouse to Improve Site Speed.
- Schema.org, Schema.org.
- Google Search Central, Understand how structured data works.
- Search Console Help, Manual Actions report.