

YouTube has been around since 2005. Since that time, digital marketing has completely transformed – and so have users’ behavior on the platform. In this infographic, explore YouTube consumer trends and behaviors to understand just how the platform is being used so that you can leverage it strategically in your marketing.
Looking for additional guidance with YouTube? Our paid media experts can help. To explore the untapped YouTube growth opportunities that are waiting for you, send a message to our team today.
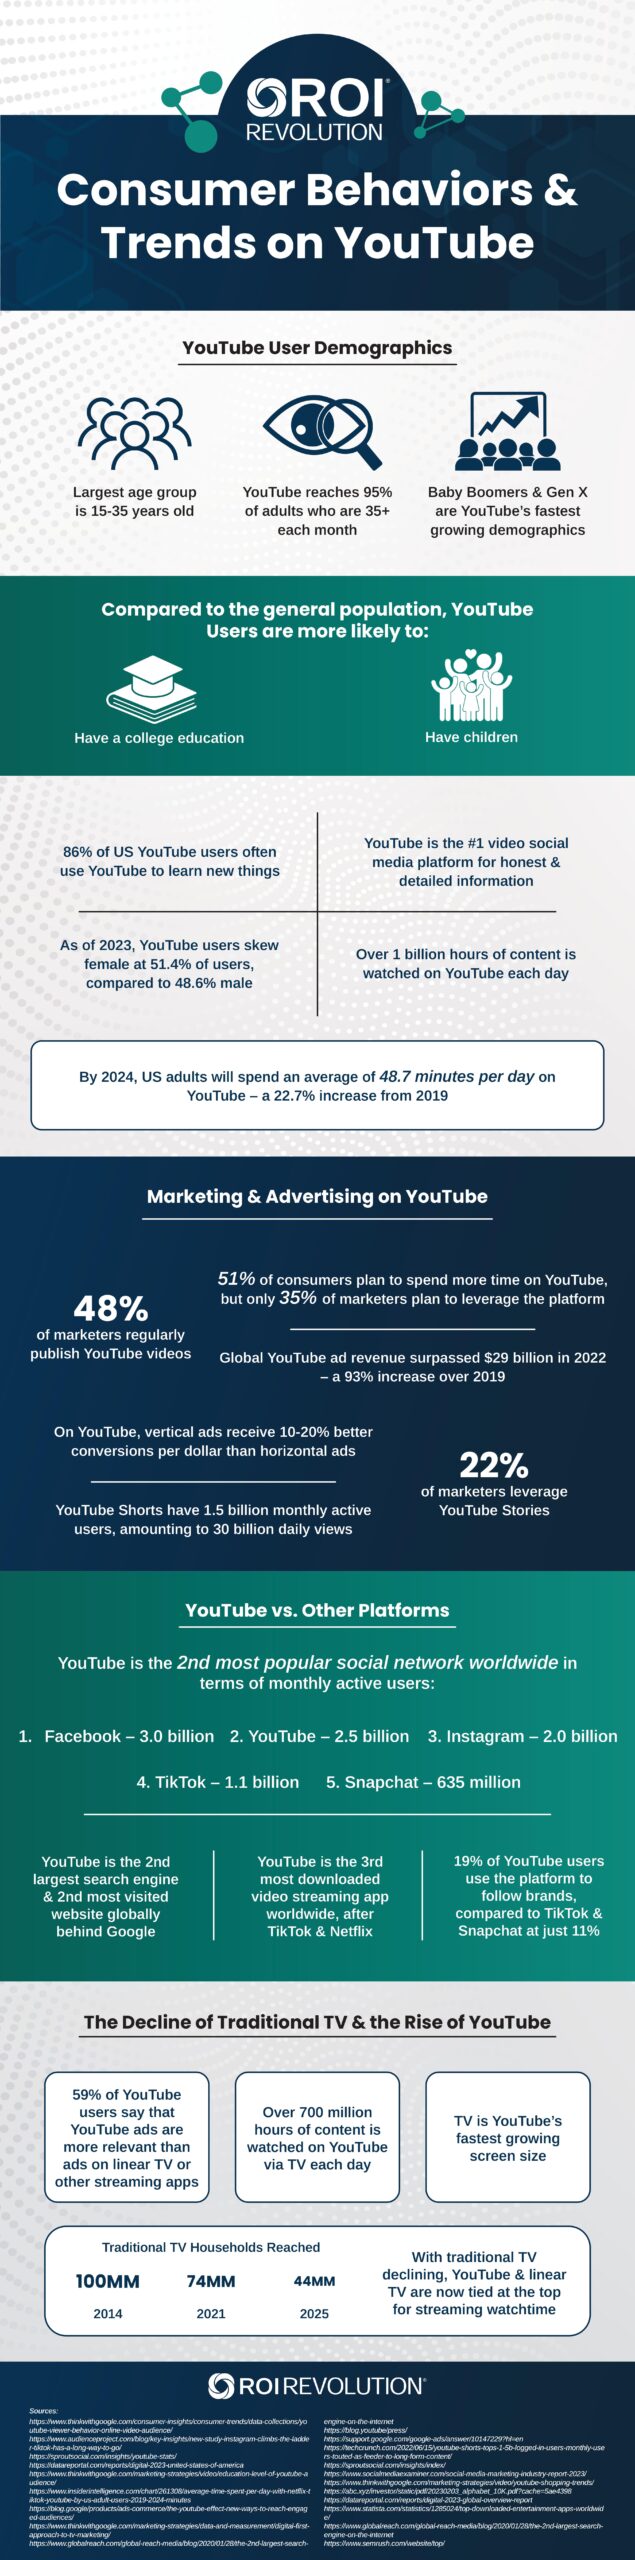
Infographic: Consumer Behaviors & Trends on YouTube
YouTube User Demographics
- Largest age group is 15-35 years old
- YouTube reaches 95% of adults who are 35+ each month
- Baby Boomers & Gen X are YouTube’s fastest growing demographics
Compared to the general population, YouTube users are more likely to:
- Have a college education
- Have children
86% of US YouTube users often use YouTube to learn new things
YouTube is the #1 video social media platform for honest & detailed information
As of 2023, YouTube users skew female at 51.4% of users, compared to 48.6% male
Over 1 billion hours of content is watched on YouTube each day
By 2025, US adults will spend an average of 48.7 minutes per day on YouTube – a 22.7% increase from 2019
Marketing & Advertising on YouTube
- 48% of marketers regularly publish YouTube videos
- 51% of consumers plan to spend more time on YouTube, but only 35% of marketers plan to leverage the platform
- Global YouTube ad revenue surpassed $29 billion in 2022 – a 93% increase over 2019
- On YouTube, vertical ads receive 10-20% better conversions per dollar than horizontal ads
- YouTube Shorts have 1.5 billion monthly active users, amounting to 30 billion daily views
- 22% of marketers leverage YouTube Stories
YouTube vs. Other Platforms
- YouTube is the second most popular social network worldwide in terms of monthly active users:
- Facebook: 3.0 billion
- YouTube: 2.5 billion
- Instagram: 2.0 billion
- TikTok: 1.1 billion
- Snapchat: 635 million
- YouTube is the second largest search engine & second most visited website globally behind Google
- YouTube is the third most downloaded video streaming app worldwide, after TikTok & Netflix
- 19% of YouTube users use the platform to follow brands, compared to TikTok & Snapchat at just 11%
The Decline of Traditional TV & the Rise of YouTube
- 59% of YouTube users say that YouTube ads are more relevant than ads on linear TV or other streaming apps
- Over 700 million hours of content is watched on YouTube via TV each day
- TV is YouTube’s fastest growing screen size
- With traditional TV declining, YouTube & linear TV are now tied at the top for streaming watchtime
- Traditional TV households reached:
- 2014: 100MM
- 2021: 74MM
- 2025: 44MM
Sources
- Think with Google, The Latest YouTube Stats on Audience Demographics: Who’s Tuning In.
- AudienceProject, New study: Instagram climbs the ladder, TikTok has a long way to go.
- SproutSocial, 30 YouTube statistics to power your marketing strategy in 2023.
- DataReportal, Digital 2023: The United States of America.
- Think with Google, YouTube users are more likely to have a college degree compared to the general population.
- eMarketer, Average Time Spent per Day With Netflix, TikTok, and YouTube by US Adult Users, 2019-2024.
- Google Ads & Commerce Blog, The YouTube Effect: New ways to reach engaged audiences.
- Think with Google, Full stream ahead: Why TV’s shift to digital is an opportunity brands can’t miss.
- Global Reach, The 2nd Largest Search Engine on the Internet.
- YouTube Official Blog, YouTube for Press.
- Google Ads Help, About Video action campaigns.
- TechCrunch, YouTube Shorts tops 1.5B logged-in monthly users, touted as feeder to long-form content.
- SproutSocial, Social Media Trends for 2022 & Beyond.
- Social Media Examiner, 2023 Social Media Marketing Industry Report.
- Think with Google, 3 YouTube creators explore the shopping trends inspiring today’s consumers.
- United States Securities and Exchange Commission, Annual Report for Alphabet Inc.
- DataReportal, Digital 2023: Global Overview Report.
- Statista, Leading entertainment and video streaming apps worldwide in 2022, by downloads.
- SEMRush, Top websites.