

Note, this blog is related to Universal Analytics, which has been deprecated. To view information about Google Analytics 4 (GA4), please visit our Latest Updates on GA4.
If you’ve read Shawn’s Article about tracking autoresponders, you know that Google Analytics’ Site Search tool can be utilized to track secondary sources. Toward the end of this post I’ll give you a way to use Site Search to track the effectiveness and value of a section, such as a blog section, as well as a page’s contribution to conversion rate as a member of that section.
But first, a little background info:
If you’ve spent any time in the Google Analytics reports, you’ve probably noticed the $index field in the Top Content reports that somehow represents a page’s relative worth. This field can be a great way to get an idea of a page’s contribution to the success of your goals and ecommerce revenue.
But where do the numbers for $index even come from? If you click the question mark button next to $Index in the Top Content report, you will receive the following explanation:
“The average value of this page or set of pages. $Index is (Ecommerce revenue + Total Goal Value) divided by Pageviews for the page(s).”
Now it turns out that there are a few subtleties that are not indicated by the definition. For starters, the formula is actually using unique pageviews rather than pageviews.
Second, if you look at the $index of a page and compare it to the Per Visit Goal Value or Per Visit Value of that page (depending on whether you have a lead gen site or an ecommerce site) after drilling down into the page and segmenting by source (or medium, or source/medium if you’ve installed my Greasemonkey script), chances are very good that the two values are relatively close, but certainly not equal.
Why is that? Here’s why.A goal conversion or transaction will only count toward a page’s $index value if the page was viewed at some point prior to the conversion or transaction. I’ll illustrate with this awesome drawing I did in MS Paint:
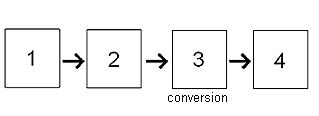
This drawing represents a 4 page visit to the site. As you can see, the conversion took place on page 3. Let’s say this conversion was worth $10. If this were the only visit to your site, then pages 1, 2, and probably 3 (depending on whether the conversion registered prior to the pageview–possible for ecommerce) would each have a $index of $10. Page 4, on the other hand, would have a $index of $0 because the page 4 only appeared in the visit after the conversion took place.
Now if you look at pages 1, 2 and 3 together, you would see that their combined $index would equal $10.
At first this might seem OK, but let’s take add a few extra visits into the mix. Assume we now have 3 additional visits that converted, again with each conversion worth $10. The $index for pages 5, 6, and 7 is $10 each and the combined $index is also $10.
Notice that while the combined $index for pages 5, 6, and 7 is the same as that for pages 1, 2, and 3, the total revenue generated from pages 5, 6, and 7 is $30, while the total revenue generated from pages 1, 2, and 3 is only $10. That’s because the $index for a group of pages does not take into account the fact that the pages are not mutually exclusive–that is, two different pages may be attributed with the same conversion or transaction. Thus each conversion or transaction may be represented multiple times in a group of pages.
Basically this means that $index is not a very precise measure of a group of pages overall value. The only exception to this is Site Avg. for $index, which is calculate by dividing total site revenue by the number of unique pageviews for all site traffic.
One way we could try to leverage this is to create a profile that includes just traffic to the section we’re interested in. This seems like it would allow to have a precise Now the site average for $index will provide a precise measurement for the value of that section. Of course, there a couple issues with this:
- If you’re calculating conversion values using goals, you will have to include those goal pages in this profile.
- Including or excluding pages has no affect on which transactions show up in your profile.
This effectively means that the site average for $index will still not reflect the value of that section because it will take into account every visitor who hits your goal page and/or every visitor who registers an ecommerce transaction, even if they never saw your section.
There is, however, another way to enable section tracking. You can do this by following these steps:
Step 1: You’ll need to modify your Google Analytics Tracking Code. Look for the following line:
pageTracker._trackPageview();
Replace this line with the following:
This code is set up to track the entire blog directory as a section. You can modify this code to track a different section by modifying the regular expression. For example, you could replace “blog” with “store” if you have a store subdirectory you want to track.
Basically, this code creates a custom pageTracker which registers the same pageview as a standard pageTracker with the addition of the query parameter “section” equal to the value of everything in the request stem after “/blog”.
Step 2: Enable Site Search for your profile with the query parameter “section”. You can do this by editing the profile settings, editing the main profile settings, selecting “Do Track Site Search” and entering “section” in the Query Parameter Field. If you are already using Site Search for something else, you should create a separate profile. You should also select “Yes, strip query parameters out of URL” so your content data stays clean.
That’s it! Give the data some time to collect, then go to Content->Site Search->Search Terms to see a report similar to this:
A few notes about how this report will work:
- Both goal conversions and transactions are attributed to the last page viewed in a section only. This means that all pages in a section are mutually exclusive when it comes to calculating the conversion rate for the section. So now you can measure the effectiveness of the section as a whole, each individual pageview in that section, and groups of pageviews within that section.
- Total Unique Searches = Unique Pageviews.
- Results Pageviews/Search = Pageviews/Section (after and including page listed).
- % Search Exits = % Site exits from page listed.
- % Search Refinements = % Visits resulting in further section pageviews.
- Time after Search = Time spent on rest of site after visiting page listed.
- Search Depth = Number of pages viewed on rest of site after leaving section from page listed.
If you find this useful or have any questions about this modification, the Site Search Report, or $index, let me know!